|

EUR/JPY Price Analysis: Upside capped just above 130.00

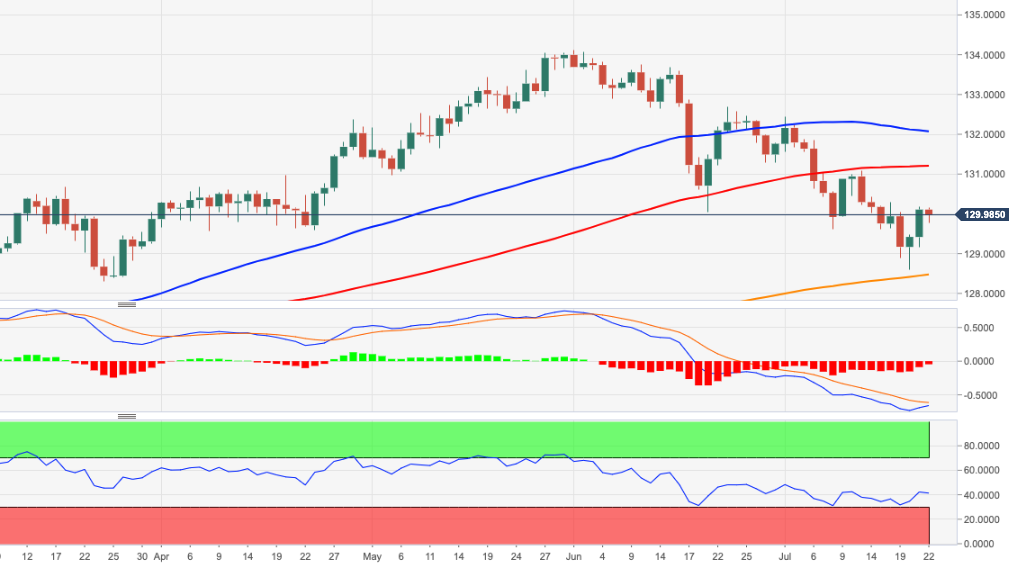
  • EUR/JPY’s recovery falters in the 130.20 area so far.
  • The next hurdle of note comes in at the 131.00 region.

After bottoming out in the mid-128.00s in the first half of the week, EUR/JPY seems to have regained some composure. However, the bullish attempt appears to have run out of steam just past the psychological 130.00 mark.

The continuation of the recovery could extend to the 131.00 neighbourhood, where coincides weekly highs and the 100-day SMA. The surpass of this area should mitigate the downside pressure.

In the meantime, a move to the 200-day SMA near 128.41 should also be negated if the cross manages to clear 131.00, ideally in the very short term.

EUR/JPY daily chart

EUR/JPY

Overview
Today last price130
Today Daily Change37
Today Daily Change %-0.08
Today daily open130.11
 
Trends
Daily SMA20130.87
Daily SMA50132.11
Daily SMA100131.2
Daily SMA200128.45
 
Levels
Previous Daily High130.19
Previous Daily Low129.16
Previous Weekly High131.09
Previous Weekly Low129.61
Previous Monthly High134.13
Previous Monthly Low130.04
Daily Fibonacci 38.2%129.8
Daily Fibonacci 61.8%129.55
Daily Pivot Point S1129.45
Daily Pivot Point S2128.79
Daily Pivot Point S3128.42
Daily Pivot Point R1130.48
Daily Pivot Point R2130.85
Daily Pivot Point R3131.5

Author

Pablo Piovano

Born and bred in Argentina, Pablo has been carrying on with his passion for FX markets and trading since his first college years.

More from Pablo Piovano
Share:

Editor's Picks

EUR/USD loses ground below 1.1850 ahead of FOMC Minutes

The EUR/USD pair loses traction near 1.1840 during the early European session on Wednesday, pressured by renewed US Dollar demand. Traders brace for the Federal Open Market Committee Minutes for signals on future rate cuts, which will be released later on Wednesday. 

When is the UK CPI data and how could it affect GBP/USD?

The United Kingdom Consumer Price Index data for January is scheduled to be published today at 07:00 GMT. GBP/USD trades slightly lower at around 1.3556 as of writing. The 20-period Exponential Moving Average trends lower at 1.3593 and continues to cap rebounds. Price holds beneath this gauge, maintaining a short-term bearish bias.

Gold: Is the $5,000 level back in sight?

Gold snaps a two-day downtrend, as recovery gathers traction toward $5,000 on Wednesday. The US Dollar recovers from the overnight sell-off as rebalancing trades resume ahead of Fed Minutes. The 38.2% Fib support holds on the daily chart for now. What does that mean for Gold?

Pi Network rally defies market pressure ahead of its first anniversary

Pi Network is trading above $0.1900 at press time on Wednesday, extending the weekly gains by nearly 8% so far. The steady recovery is supported by a short-term pause in mainnet migration, which reduces pressure on the PI token supply for Centralized Exchanges. The technical outlook focuses on the $0.1919 resistance as bullish momentum increases.

UK jobs market weakens, bolstering rate cut hopes

In the UK, the latest jobs report made for difficult reading. Nonetheless, this represents yet another reminder for the Bank of England that they need to act swiftly given the collapse in inflation expected over the coming months. 

Top 3 Price Prediction: Bitcoin, Ethereum, and Ripple face downside risk as bears regain control

Bitcoin, Ethereum, and Ripple remain under pressure on Wednesday, with the broader trend still sideways. BTC is edging below $68,000, nearing the lower consolidating boundary, while ETH and XRP also declined slightly, approaching their key supports.