EUR/JPY Price Analysis: Struggles around 142.00, tanks below 140.50
- The EUR/JPY buyers’ failure at weekly highs left the euro vulnerable to selling pressure.
- Sentiment shifted to mildly risk-off on Google news, and the Italy government is about to collapse.
- EUR/JPY Price Analysis: Sellers regained control around 142.00; if the ECB fails to deliver, expect further downside below 140.00.

The EUR/JPY nosedives from two-week highs, erasing almost 50% of its weekly gains, and tumbles towards the 20-day EMA at 140.50, as sellers are eyeing a break before the ECB’s monetary policy decision on Thursday. Also, a mixed market mood increased safe-haven appetite, such as the Japanese yen, which strengthened by almost 0.50% vs. the euro. At the time of writing, the EUR/JPY is trading at 140.48.
EUR/JPY Price Analysis: Technical outlook
The EUR/JPY opened near the highs of the day, shy of the 141.50 area, though later, the cross pushed towards the R1 daily pivot, short of the 142.00, sellers stepped in, sending prices tanking below the daily pivot, at 140.59, before entering a sideways range. Nevertheless, geopolitical news regarding Italy’s government about to collapse opened the door for further downside pressure, hitting a fresh daily low at 140.42.
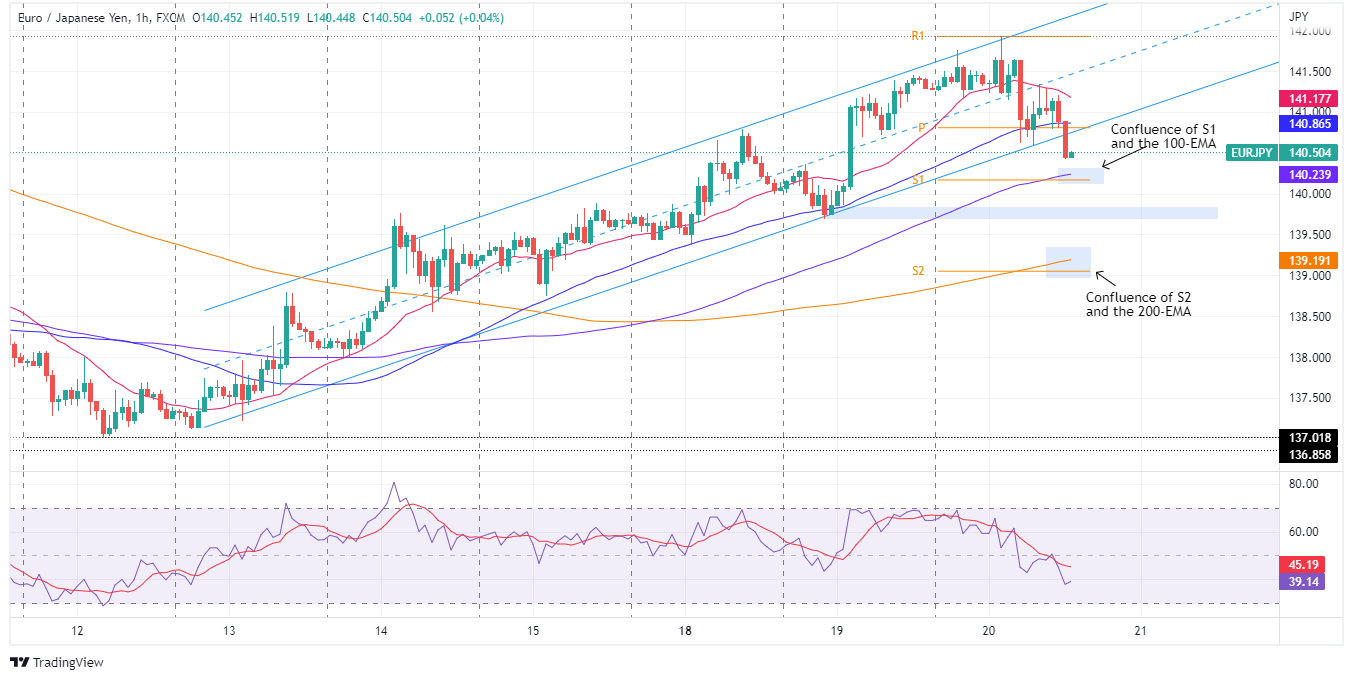
EUR/JPY 1-hour chart
The EUR/JPY 1-hour chart depicts the cross-currency breaking below an ascending channel, which opens the door for further selling pressure. Although the EUR/JPY might find some bids around the confluence of the S1 daily pivot and the 100-hour EMA around 140.15-25, it could not deter sellers from applying further pressure as the euro’s outlook continues to deteriorate.
Therefore, the EUR/JPY next support would be 140.00, followed by July 18 low around 139.69, not that close to 139.50, before resuming towards the 139.00-20 area, surrounded by the 200-hour EMA and the S2 daily pivot.
EUR/JPY Key Technical Levels
Author

Christian Borjon Valencia
FXStreet
Markets analyst, news editor, and trading instructor with over 14 years of experience across FX, commodities, US equity indices, and global macro markets.


