|

EUR/JPY Price Analysis: Next target now emerges at 170.00

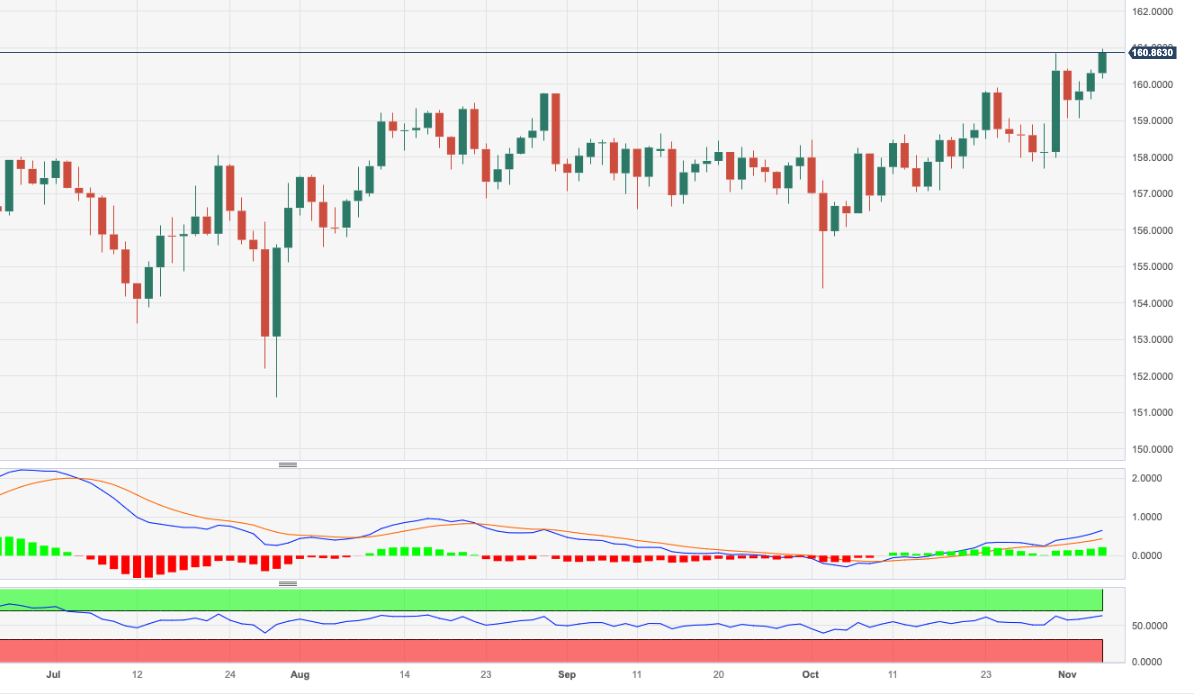
  • EUR/JPY advances to new 2023 tops near 161.00.
  • Immediately to the upside emerges the 2008 peak near 170.00.

EUR/JPY prints new yearly highs in levels just shy of 161.00 the figure at the beginning of the week.

Further upside appears well on the cards for the cross in the short-term horizon. Against that, the surpass of the 2023 high of 160.98 (November 6) should face the next significant resistance level not before the 2008 top of 169.96 (July 23)

So far, the longer term positive outlook for the cross appears favoured while above the 200-day SMA, today at 151.72.

EUR/JPY daily chart

EUR/JPY

Overview
Today last price160.88
Today Daily Change87
Today Daily Change %0.36
Today daily open160.31
 
Trends
Daily SMA20158.58
Daily SMA50158.1
Daily SMA100157.45
Daily SMA200151.67
 
Levels
Previous Daily High160.4
Previous Daily Low159.6
Previous Weekly High160.85
Previous Weekly Low157.7
Previous Monthly High160.85
Previous Monthly Low154.39
Daily Fibonacci 38.2%160.09
Daily Fibonacci 61.8%159.9
Daily Pivot Point S1159.8
Daily Pivot Point S2159.29
Daily Pivot Point S3158.99
Daily Pivot Point R1160.61
Daily Pivot Point R2160.91
Daily Pivot Point R3161.42

Author

Pablo Piovano

Born and bred in Argentina, Pablo has been carrying on with his passion for FX markets and trading since his first college years.

More from Pablo Piovano
Share:

Editor's Picks

EUR/USD loses ground below 1.1850 ahead of FOMC Minutes

The EUR/USD pair loses traction near 1.1840 during the early European session on Wednesday, pressured by renewed US Dollar demand. Traders brace for the Federal Open Market Committee Minutes for signals on future rate cuts, which will be released later on Wednesday. 

When is the UK CPI data and how could it affect GBP/USD?

The United Kingdom Consumer Price Index data for January is scheduled to be published today at 07:00 GMT. GBP/USD trades slightly lower at around 1.3556 as of writing. The 20-period Exponential Moving Average trends lower at 1.3593 and continues to cap rebounds. Price holds beneath this gauge, maintaining a short-term bearish bias.

Gold: Is the $5,000 level back in sight?

Gold snaps a two-day downtrend, as recovery gathers traction toward $5,000 on Wednesday. The US Dollar recovers from the overnight sell-off as rebalancing trades resume ahead of Fed Minutes. The 38.2% Fib support holds on the daily chart for now. What does that mean for Gold?

Pi Network rally defies market pressure ahead of its first anniversary

Pi Network is trading above $0.1900 at press time on Wednesday, extending the weekly gains by nearly 8% so far. The steady recovery is supported by a short-term pause in mainnet migration, which reduces pressure on the PI token supply for Centralized Exchanges. The technical outlook focuses on the $0.1919 resistance as bullish momentum increases.

UK jobs market weakens, bolstering rate cut hopes

In the UK, the latest jobs report made for difficult reading. Nonetheless, this represents yet another reminder for the Bank of England that they need to act swiftly given the collapse in inflation expected over the coming months. 

Top 3 Price Prediction: Bitcoin, Ethereum, and Ripple face downside risk as bears regain control

Bitcoin, Ethereum, and Ripple remain under pressure on Wednesday, with the broader trend still sideways. BTC is edging below $68,000, nearing the lower consolidating boundary, while ETH and XRP also declined slightly, approaching their key supports.