|

EUR/JPY Price Analysis: Further consolidation not ruled out

  • EUR/JPY meets some selling pressure after two daily advances.
  • Initial contention emerges at monthly lows near 132.90.

EUR/JPY fades two consecutive daily advances and now looks offered in the low-133.00s.

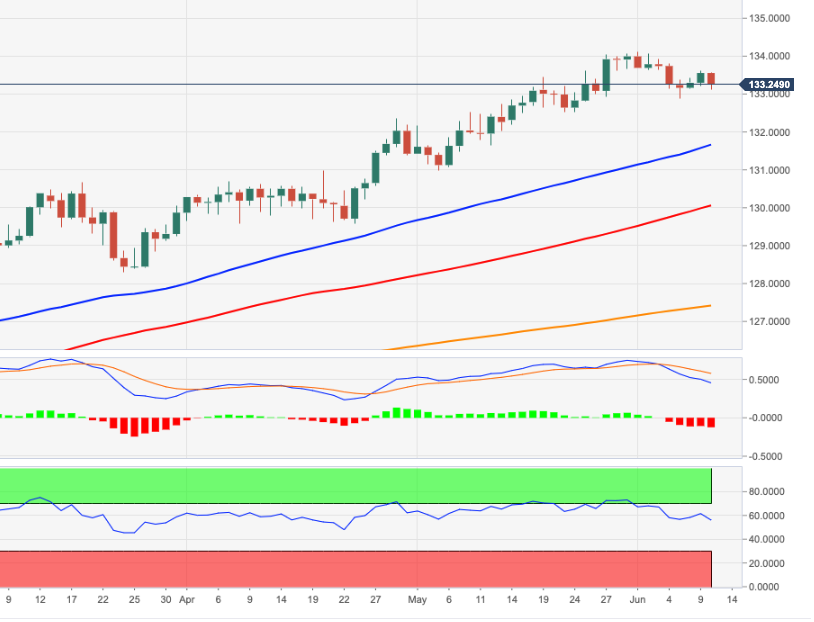
If the selling pressure gathers extra steam, then the cross could attempt a deeper pullback to, initially, the monthly lows near 132.90 (June 7). Further south comes in the 132.83/57 band, where converges the 50-day SMA and the short-term support line (off March lows).

In the broader picture, while above the 200-day SMA at 127.38 the outlook for the cross should remain constructive.

EUR/JPY daily chart

EUR/JPY

Overview
Today last price133.23
Today Daily Change44
Today Daily Change %-0.25
Today daily open133.56
 
Trends
Daily SMA20133.25
Daily SMA50131.81
Daily SMA100129.99
Daily SMA200127.39
 
Levels
Previous Daily High133.63
Previous Daily Low133.21
Previous Weekly High134.13
Previous Weekly Low133.14
Previous Monthly High134.06
Previous Monthly Low130.98
Daily Fibonacci 38.2%133.47
Daily Fibonacci 61.8%133.37
Daily Pivot Point S1133.3
Daily Pivot Point S2133.04
Daily Pivot Point S3132.88
Daily Pivot Point R1133.72
Daily Pivot Point R2133.88
Daily Pivot Point R3134.14

Author

Pablo Piovano

Born and bred in Argentina, Pablo has been carrying on with his passion for FX markets and trading since his first college years.

More from Pablo Piovano
Share:

Editor's Picks

EUR/USD weakens below 1.1700 as Middle East tensions drive US Dollar strength

The EUR/USD pair trades with mild losses around 1.1685, the lowest since late January, during the early Asian session on Tuesday. The US Dollar gathers strength against the Euro as escalating tensions in the Middle East boost safe-haven currencies. The preliminary reading of the Harmonized Index of Consumer Prices from the Eurozone will be published later on Tuesday.  

GBP/USD hovers around 1.3400 with bearish pressure intact

GBP/USD edges higher after three days of losses, trading around 1.3400 during the Asian hours on Tuesday. The technical analysis of the daily chart indicates an ongoing bearish bias, as the pair trades within a descending channel pattern.

Gold defends bids as US-Iran war continues to fuel safe-haven flows

Gold retains positive bias for the fifth consecutive day on Tuesday as rising geopolitical tensions in the Middle East continue to underpin safe-haven assets. However, a bullish US Dollar keeps the bullion below its highest level since late January, set on Monday, warranting caution before positioning for any further appreciation.

Strategy lifts holdings to 3.4% of Bitcoin's total supply amid inflows into crypto products

Strategy continued its accumulation of the top crypto last week, acquiring 3,015 BTC for $204 million amid renewed interest in crypto products after four weeks of outflows.

The market is not panicking it is repricing the probability distribution of Oil and time

At the end of the day, markets do not trade morality or geopolitics. They trade transmission channels. And the only channel that truly matters in this maelstrom runs through the price of energy and the time value of money.

Grass 20% bullish breakout defies broader market weakness

Grass (GRASS) is edging up above $0.30 at the time of writing on Monday. The token’s notable 20% intraday surge stands out amid heightened volatility in the broader crypto market.