|

EUR/JPY Price Analysis: Euro kicks off 2020 with a drop to two-week lows near 121.00 handle

  • EUR/JPY retracement down is extending as 2020 is starting. 
  • The level to beat for bears is the 121.00 figure. 
 

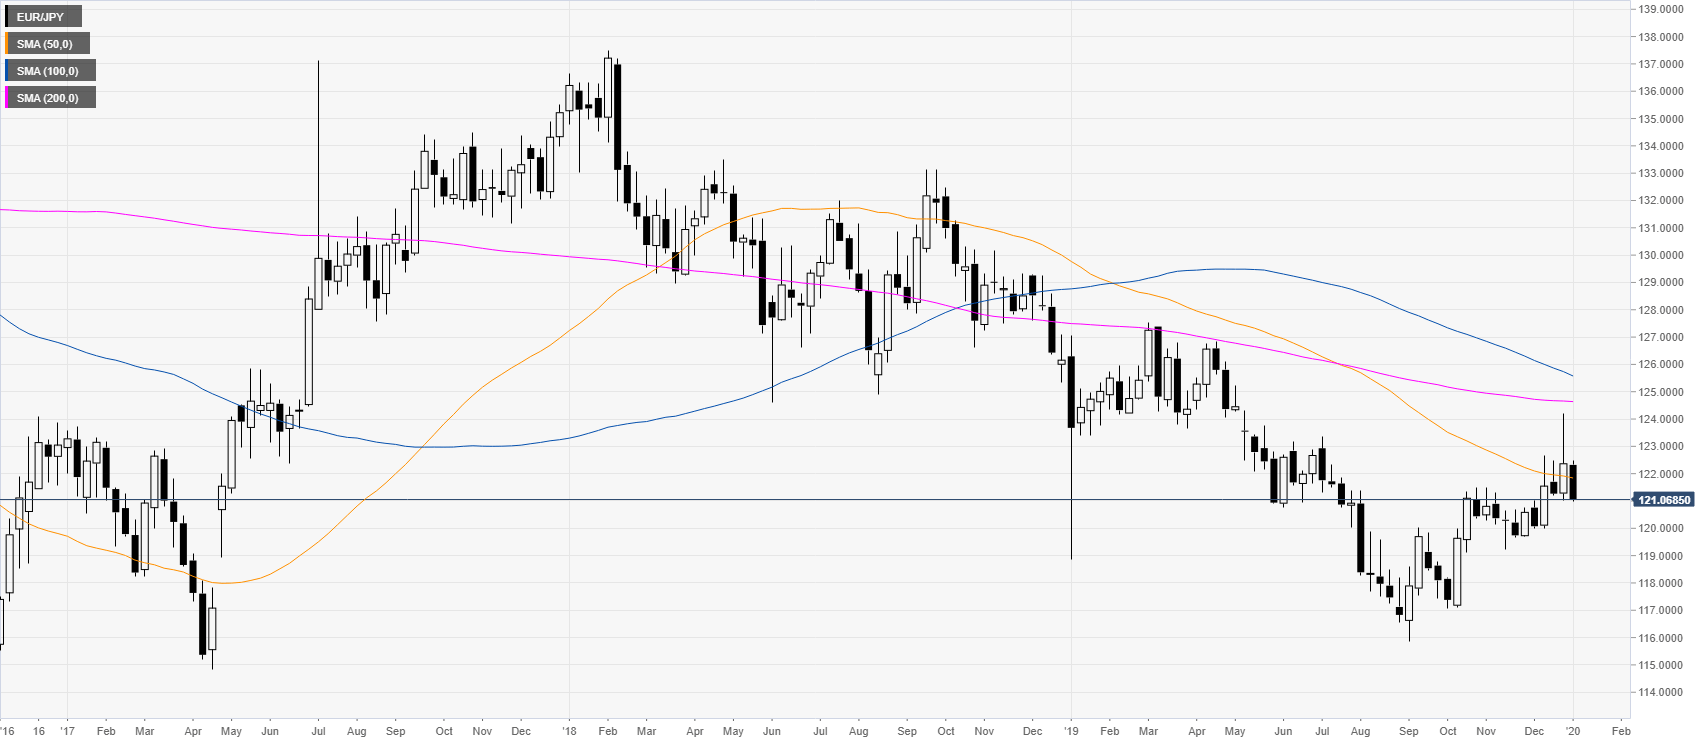
EUR/JPY weekly chart

 
EUR/JPY is trading in a bear flag wile below the main weekly simple moving averages. The market is currently rejecting the 124.00 handle. 
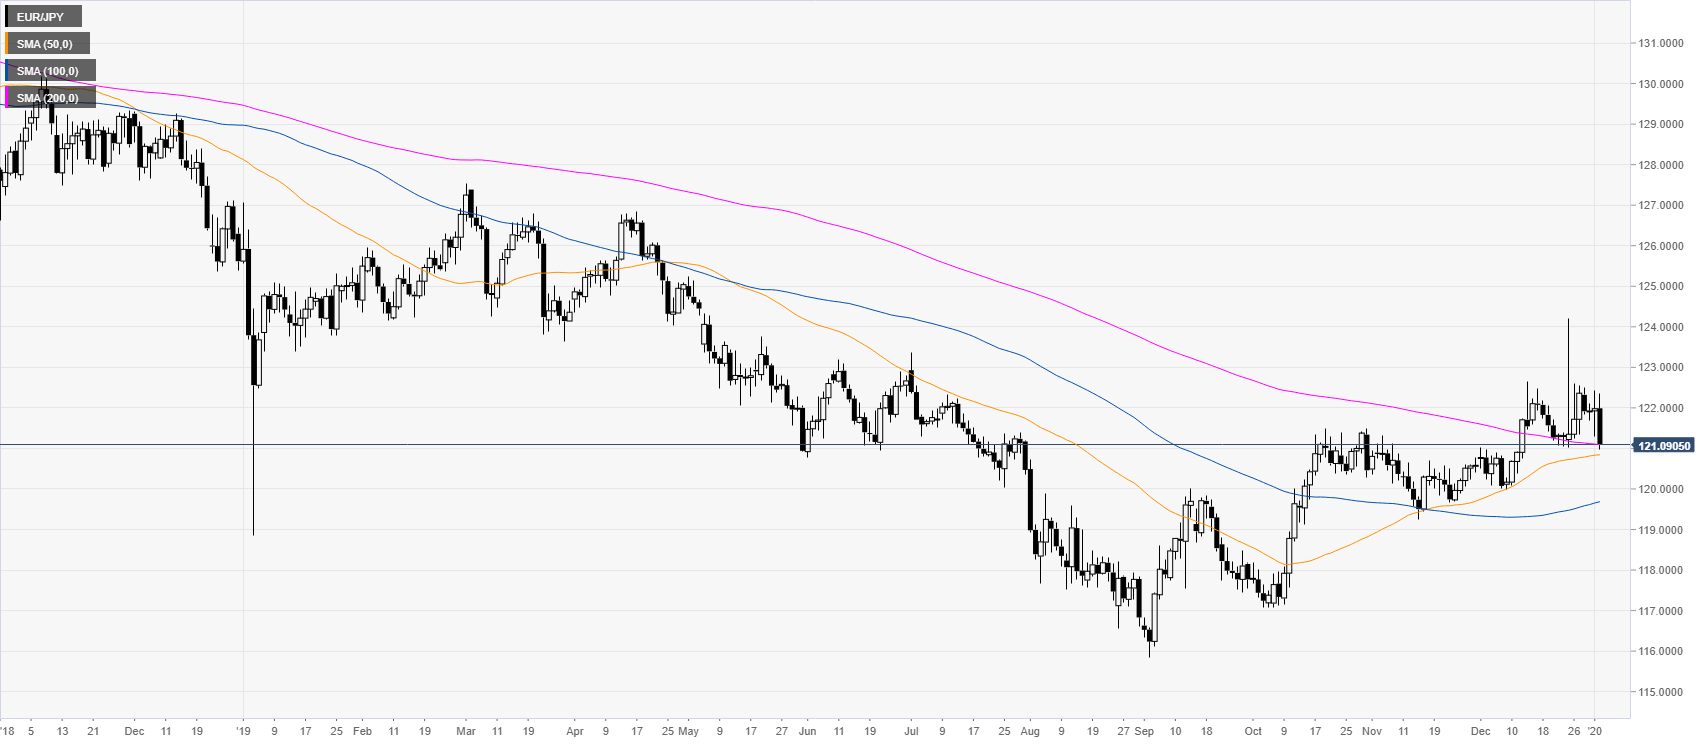
 

EUR/JPY daily chart

 
EUR/JPY is forming a head-and-shoulders top while trading above the main daily simple moving average (DMAs) and the 121.00 handle.
 

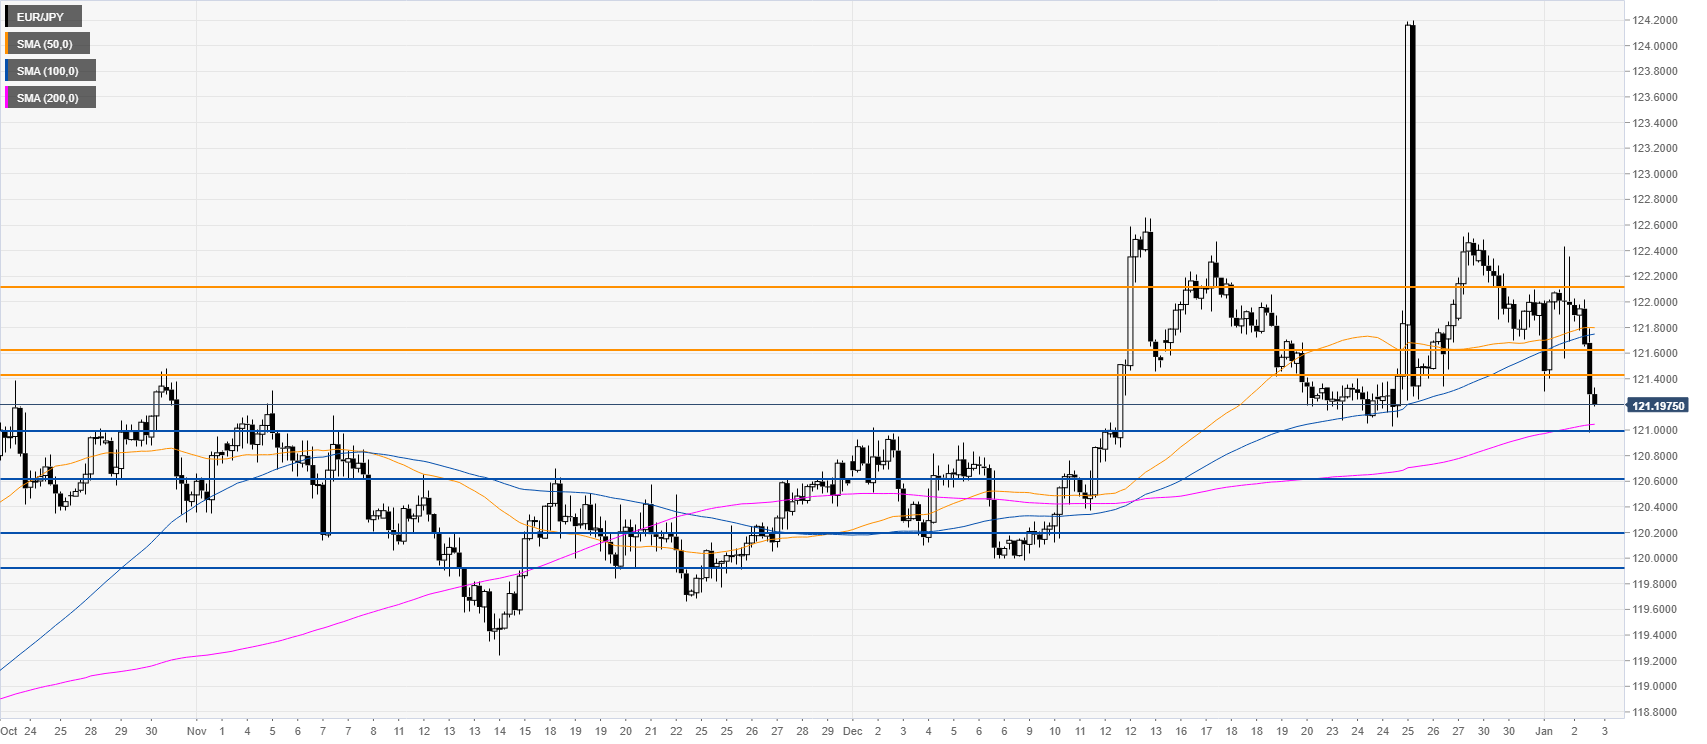
EUR/JPY four-hour chart

 
The bears are challenging the 121.00 handle and the 200-SMA on the four-hour chart. A break below the mentioned level can attract further selling interest towards 120.86, 120.61 and the 120.23/119.90 price zone. Resistance is seen at the 121.42/68 price zone and 122.12 level, according to the Technical Confluences Indicator
    

Additional key levels

EUR/JPY

Overview
Today last price121.21
Today Daily Change-0.77
Today Daily Change %-0.63
Today daily open121.98
 
Trends
Daily SMA20121.43
Daily SMA50120.83
Daily SMA100119.65
Daily SMA200121.11
 
Levels
Previous Daily High122.43
Previous Daily Low121.3
Previous Weekly High124.2
Previous Weekly Low121.03
Previous Monthly High124.2
Previous Monthly Low119.98
Daily Fibonacci 38.2%122
Daily Fibonacci 61.8%121.73
Daily Pivot Point S1121.38
Daily Pivot Point S2120.77
Daily Pivot Point S3120.25
Daily Pivot Point R1122.51
Daily Pivot Point R2123.03
Daily Pivot Point R3123.64

Author

Flavio Tosti

Flavio Tosti

Independent Analyst


More from Flavio Tosti
Share:

Editor's Picks

EUR/USD edges lower below 1.1650 as Middle East tensions fuel US Dollar strength

The EUR/USD pair trades in negative territory around 1.1635 during the early Asian session on Thursday. The US Dollar strengthens against the Euro as escalating Middle East conflict boosts safe-haven flows. Traders brace for the Eurozone Retail Sales and US weekly Initial Jobless Claims reports, which will be released later on Thursday. 

GBP/USD tests key moving averages as growth downgrade weighs

GBP/USD was nearly flat on Wednesday, edging up 0.08% to settle around 1.3370 in a quiet session. The pair has fallen sharply from its late-January high near 1.3870 and is now testing the 200-day Exponential Moving Average, with this week's one-week forex heatmap showing Pound Sterling as one of the worst performers against the US Dollar, down about 1.4% on the week.

Gold re-attempts $5,200 amid a softer USD; reduced Fed rate cut bets cap gains

Gold bounces toward $5,200 for the second consecutive day on Thursday amid a modest US Dollar weakness. Wednesday's upbeat US macro data further tempered hopes for three rate cuts by the Fed in 2026. Furthermore, escalating Middle East tensions might continue to benefit the USD's status as the global reserve currency and contribute to capping the bullion.

Ethereum jumps alongside a spike in open interest, realized price could limit upside

Ethereum has jumped above $2,100 on Wednesday, following a general recovery across the crypto market. The move was accompanied by a spike in Ethereum's open interest, which has increased to 13.43M ETH — its highest level since January 31. 

First Venezuela, now Iran: The US-China energy war escalates

At first glance, the latest escalation involving the United States with both Iran and Venezuela looks like another chapter in a long-running geopolitical story. But viewed through a broader strategic lens, something else may be unfolding: Energy.

Bittensor extends recovery despite retail demand slump

Bittensor, a leading Artificial Intelligence token, is aging up above $190 at the time of writing on Wednesday. Steady price increases characterise the broader crypto market, with Bitcoin holding above $71,000 and Ethereum above $2,000.