|

EUR/JPY Price Analysis: Drops below Tenkan and Kijun-Sen, eyes 157.00

  • EUR/JPY holds losses of 0.19% on fundamental reasons while it remains subdued for ten consecutive days.
  • Upside risks remain, but are capped at around 158.17, 158.65 and 159.00.
  • Short-term, EUR/JPY is bearish biased, as price action tumbles below the Kumo.

The EUR/JPY remains subdued for the tenth-straight day, capped on the upside by the Kijun-Sen at 158.17, while the distance between the spot price and the Ichimoku Cloud (Kumo) shrinks, suggesting that downside risks are emerging. Hence, the cross-pair is trading at 1573.60, down 0.19%.

A fundamental reason behind the recent Euro (EUR) weakness is data showing the bloc is headed to a recession. At the same time, the European Central Bank (ECB) holds rates as fears of economic growth are tilted to the downside. Nevertheless, the ECB is adopting the Fed’s mantra of keeping rates higher for longer. That and fears that Japanese authorities could intervene in the Forex market and propel the Yen keeps traders parked on the sidelines.

The daily chart portrays the EUR/JPY trades sideways, with immediate resistance at the Kijun-Sen at 158.17. A breach of that level would expose the September 13 high of 158.65 before rallying to 159.00. Conversely, the pair’s first support would be the September 21 daily low of 157.03, followed by the top of the kumo at 156.86.

The hourly chart portrays the pair as neutral to downward biased, as it has achieved a successive series of lower highs, though it’s pending a lower low below September 21 at 157.03. In addition, the exchange rate is below the Kumo, while the Chikou Span sits below the price action and the Kumo, further confirming the bearish bias.

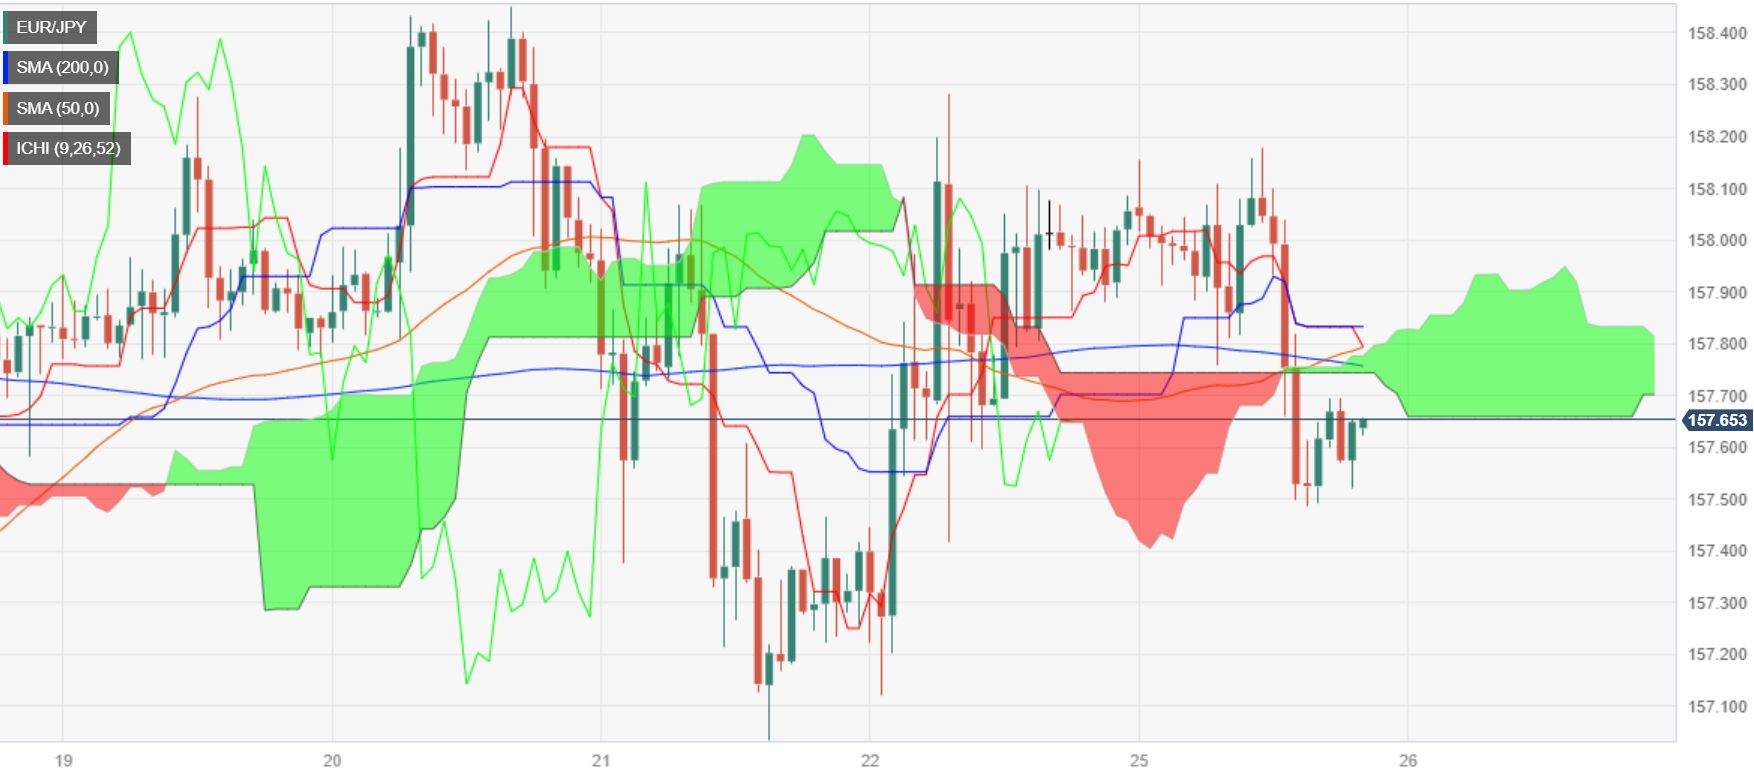
The EUR/JPY first support would be the daily low of today at 157.48, followed by last Friday’s low of 157.11. A breach of the latter would expose the 157.03, followed by the 157.00 figure. Conversely, the first resistance would be the Senkou Span B at 157.69, followed by the Tenkan-Sen's confluence and the Kumo's top at 157.79 before challenging 158.00.

EUR/JPY Price Action – Hourly chart

EUR/JPY Key Technical Levels

EUR/JPY

Overview
Today last price157.65
Today Daily Change-0.33
Today Daily Change %-0.21
Today daily open157.98
 
Trends
Daily SMA20158.04
Daily SMA50157.5
Daily SMA100154.92
Daily SMA200149.07
 
Levels
Previous Daily High158.28
Previous Daily Low157.12
Previous Weekly High158.45
Previous Weekly Low157.04
Previous Monthly High159.76
Previous Monthly Low155.53
Daily Fibonacci 38.2%157.84
Daily Fibonacci 61.8%157.56
Daily Pivot Point S1157.31
Daily Pivot Point S2156.63
Daily Pivot Point S3156.15
Daily Pivot Point R1158.47
Daily Pivot Point R2158.96
Daily Pivot Point R3159.63

Author

Christian Borjon Valencia

Christian Borjon began his career as a retail trader in 2010, mainly focused on technical analysis and strategies around it. He started as a swing trader, as he used to work in another industry unrelated to the financial markets.

More from Christian Borjon Valencia
Share:

Editor's Picks

EUR/USD deflates to fresh lows, targets 1.1600

The selling pressure on EUR/USD now gathers extra pace, prompting the pair to hit fresh multi-week lows in the 1.1625-1.1620 band on Friday. The continuation of the downward bias comes in response to further gains in the US Dollar as market participants continue to assess the mixed release of US Nonfarm Payrolls in December.

GBP/USD breaks below 1.3400, challenges the 200-day SMA

GBP/USD remains under heavy fire and retreats for the fourth consecutive day on Friday. Indeed, Cable suffers the strong performance of the Greenback, intensified post-mixed NFP, and trades at shouting distance from its critical 200-day SMA near 1.3380.

Gold flirts with yearly tops around $4,500

Gold keeps its positive bias on Friday, adding to Thursday’s advance and challenging yearly highs in the $4,500 region per troy ounce. The risk-off sentiment favours the yellow metal despite the firmer tone in the Greenback and rising US Treasury yields.

Crypto Today: Bitcoin, Ethereum, XRP risk further decline as market fear persists amid slowing demand

Bitcoin holds $90,000 but stays below the 50-day EMA as institutional demand wanes. Ethereum steadies above $3,000 but remains structurally weak due to ETF outflows. XRP ETFs resume inflows, but the price struggles to gain ground above key support.

Week ahead – US CPI might challenge the geopolitics-boosted Dollar

Geopolitics may try to steal the limelight from US data. A possible US Supreme Court ruling on tariffs could dictate market movements. A crammed data calendar next week, US CPI comes on Tuesday; Fedspeak to intensify.

XRP trades under pressure amid weak retail demand

XRP presses down on the 50-day EMA support as risk-averse sentiment spreads despite a positive start to 2026. XRP faces declining retail demand, as reflected in futures Open Interest, which has fallen to $4.15 billion.