|

EUR/JPY Price Analysis: Bears show signs of presence, long-term bullish stronghold remains unchallenged

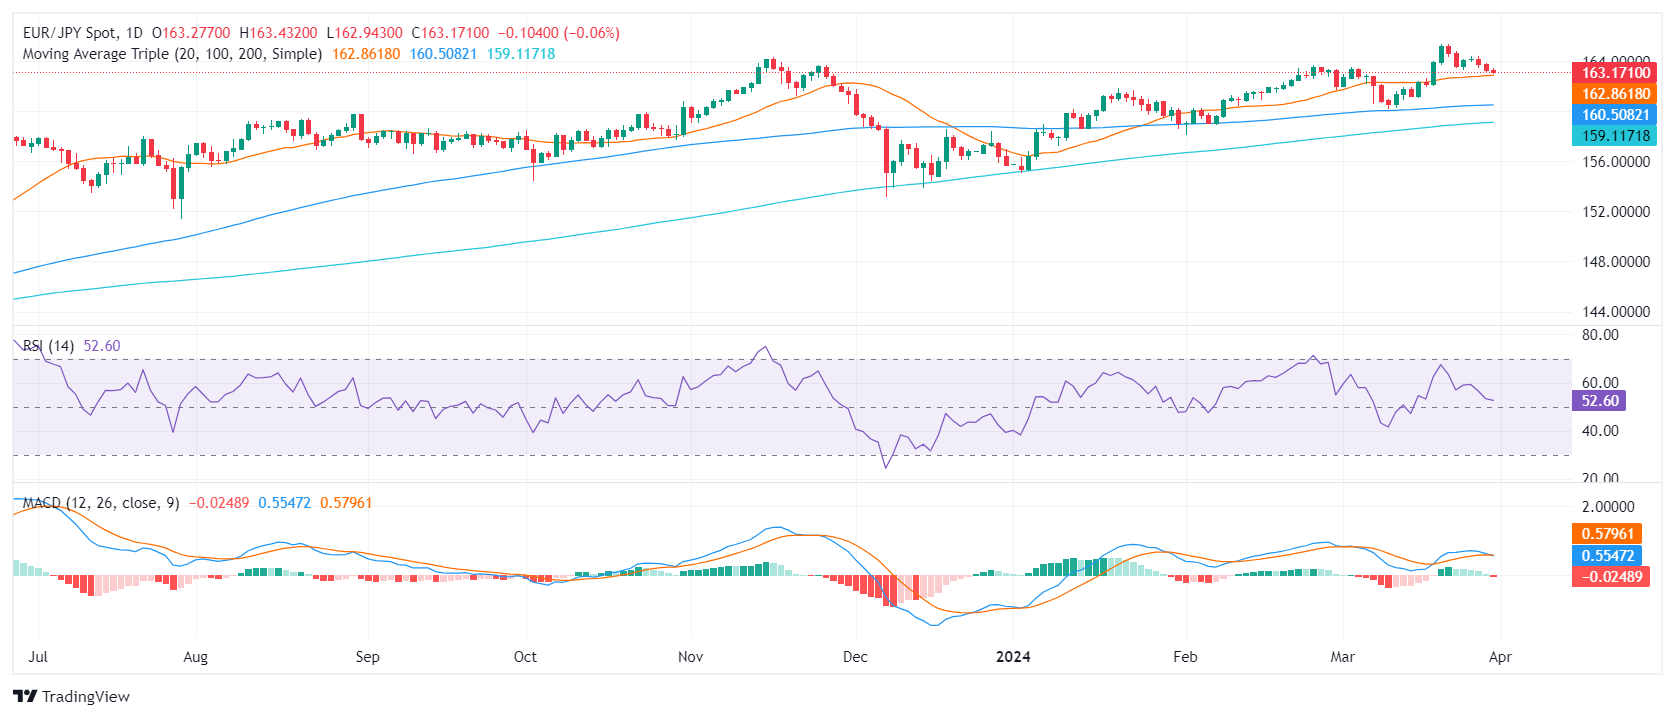
  • The daily chart reveals slightly bullish momentum, with RSI at 52, signifying resilient buying traction.
  • Indicators in the hourly chart denote a mild downward trend, which could hint at a potential shift.
  • Buyers must successfully maintain the main SMAs to mitigate bearish threats and ensure bullish continuation.

The EUR/JPY pair is currently trading at 163.13, exhibiting minimal losses. Despite the declines, the broader momentum remains bullish, but this sentiment remains finely balanced and open to fluctuations.

On the daily chart, the EUR/JPY pair indicates signs of a relatively positive to neutral momentum. The Relative Strength Index (RSI) has maneuvered within the positive territory over the most recent sessions, with the latest reading positioned at 52. This reading suggests a slightly bullish momentum, yet potentially susceptible to changes in market sentiment. Meanwhile, the red bar on the Moving Average Convergence Divergence (MACD) histogram suggests negative momentum, signaling that the sellers might be gearing up.

EUR/JPY daily chart

Shifting focus onto the hourly chart, fluctuations are more noticeable. The RSI values display a slight downward trend throughout the latest hours, reaching as low as 46. Alongside this, the consistently shrinking green bars of the MACD confirms the overall bearish momentum.

EUR/JPY hourly chart

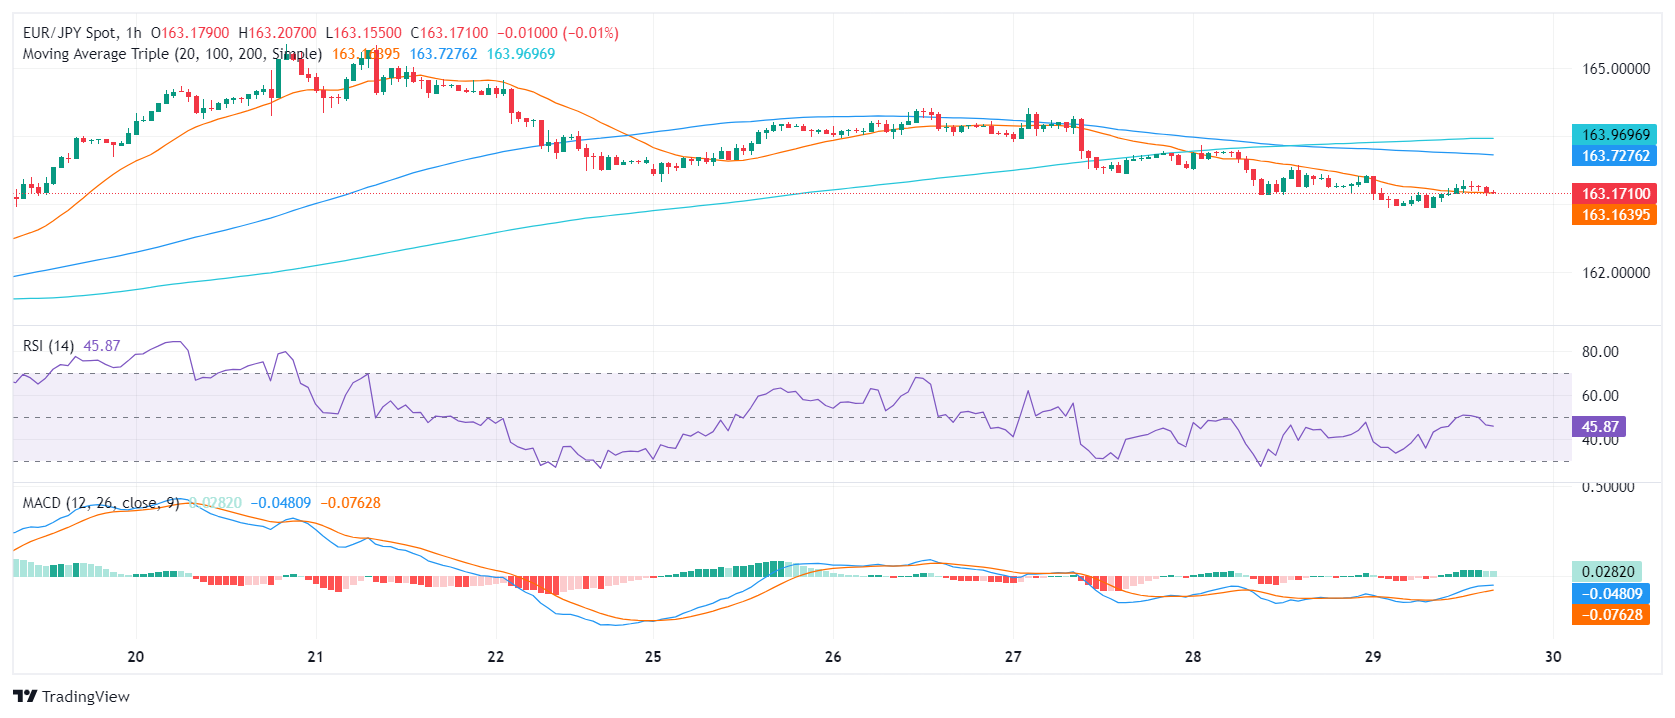
In conclusion, while short-term indicators might show an inclination toward a sellers' market, it's important to note this is within a broader bullish context as seen on the daily chart. Buyers must step in and defend the 20-day SMA at 162.85 to leave the overall bullish trend intact.

EUR/JPY

Overview
Today last price163.16
Today Daily Change-0.12
Today Daily Change %-0.07
Today daily open163.28
 
Trends
Daily SMA20162.84
Daily SMA50161.83
Daily SMA100160.5
Daily SMA200159.08
 
Levels
Previous Daily High163.87
Previous Daily Low163.14
Previous Weekly High165.36
Previous Weekly Low161.95
Previous Monthly High163.72
Previous Monthly Low158.08
Daily Fibonacci 38.2%163.42
Daily Fibonacci 61.8%163.59
Daily Pivot Point S1162.98
Daily Pivot Point S2162.69
Daily Pivot Point S3162.25
Daily Pivot Point R1163.72
Daily Pivot Point R2164.16
Daily Pivot Point R3164.46

Author

Patricio Martín

Patricio is an economist from Argentina passionate about global finance and understanding the daily movements of the markets.

More from Patricio Martín
Share:

Markets move fast. We move first.

Orange Juice Newsletter brings you expert driven insights - not headlines. Every day on your inbox.

By subscribing you agree to our Terms and conditions.

Editor's Picks

EUR/USD trades around 1.1700 after rebounding from 50-day EMA

EUR/USD gains ground after three days of losses, trading around 1.1700 during the Asian hours on Wednesday. On the daily chart, technical analysis indicates a potential for a bearish bias; the 14-day Relative Strength Index at 47 confirms waning momentum.

GBP/USD climbs above 1.3500 as US Dollar weakens ahead of ISM Services PMI

GBP/USD gains some ground after registering modest gains in the previous session, trading around 1.3510 during the Asian hours on Wednesday. The pair edges higher as the US Dollar struggles ahead of the US ISM Services Purchasing Managers’ Index and JOLTs job openings due later in the day.

Gold pulls back from $4,500 amid profit-taking ahead of key US macro data

Gold struggles to capitalize on its strong weekly gains registered over the past two days and faces rejection near the $4,500 psychological mark, or over a one-week high touched during the Asian session on Wednesday. As investors digest the recent US attack on Venezuela, the prevalent risk-on environment prompts some profit-taking around the commodity. 

Bitcoin, Ethereum and Ripple cool off as rally stalls near key resistance zones

Bitcoin, Ethereum, and Ripple prices are taking a breather on Wednesday near their key resistance levels following the recent surge. BTC faces rejection at the $94,253 level, while ETH and XRP follow BTC’s footsteps, struggling near $3,308 and $2.35, respectively.

Implications of US intervention in Venezuela

Events in Venezuela are top of mind for market participants, and while developments are associated with an elevated degree of uncertainty, we are not making any changes to our markets or economic forecasts as a result of the deposition of Nicolás Maduro. 

Aave Price Forecast: AAVE eyes bullish breakout as on-chain and derivatives data turns supportive

Aave (AAVE) price hovers around $172 on Wednesday, nearing the upper trendline of the falling parallel channel pattern. A break above this technical pattern favors the bulls.