|

EUR/GBP Technical Analysis: Euro plummets to one-month lows on Brexit news
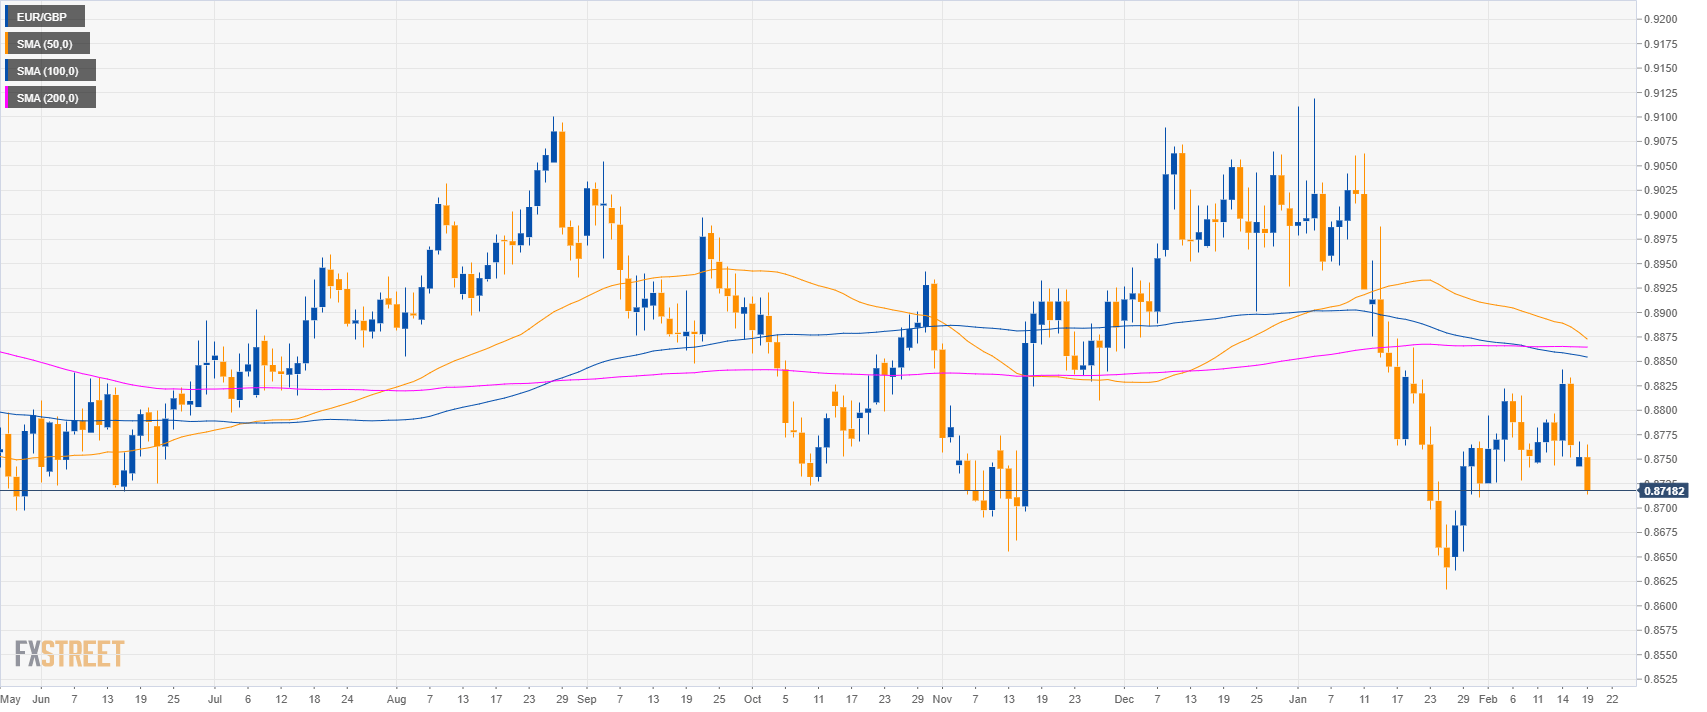
EUR/GBP daily chart

EUR/GBP 4-hour chart

  • EUR/GBP is trading below the main SMAs on the 4-hour chart suggesting a bearish market in the medium-term.


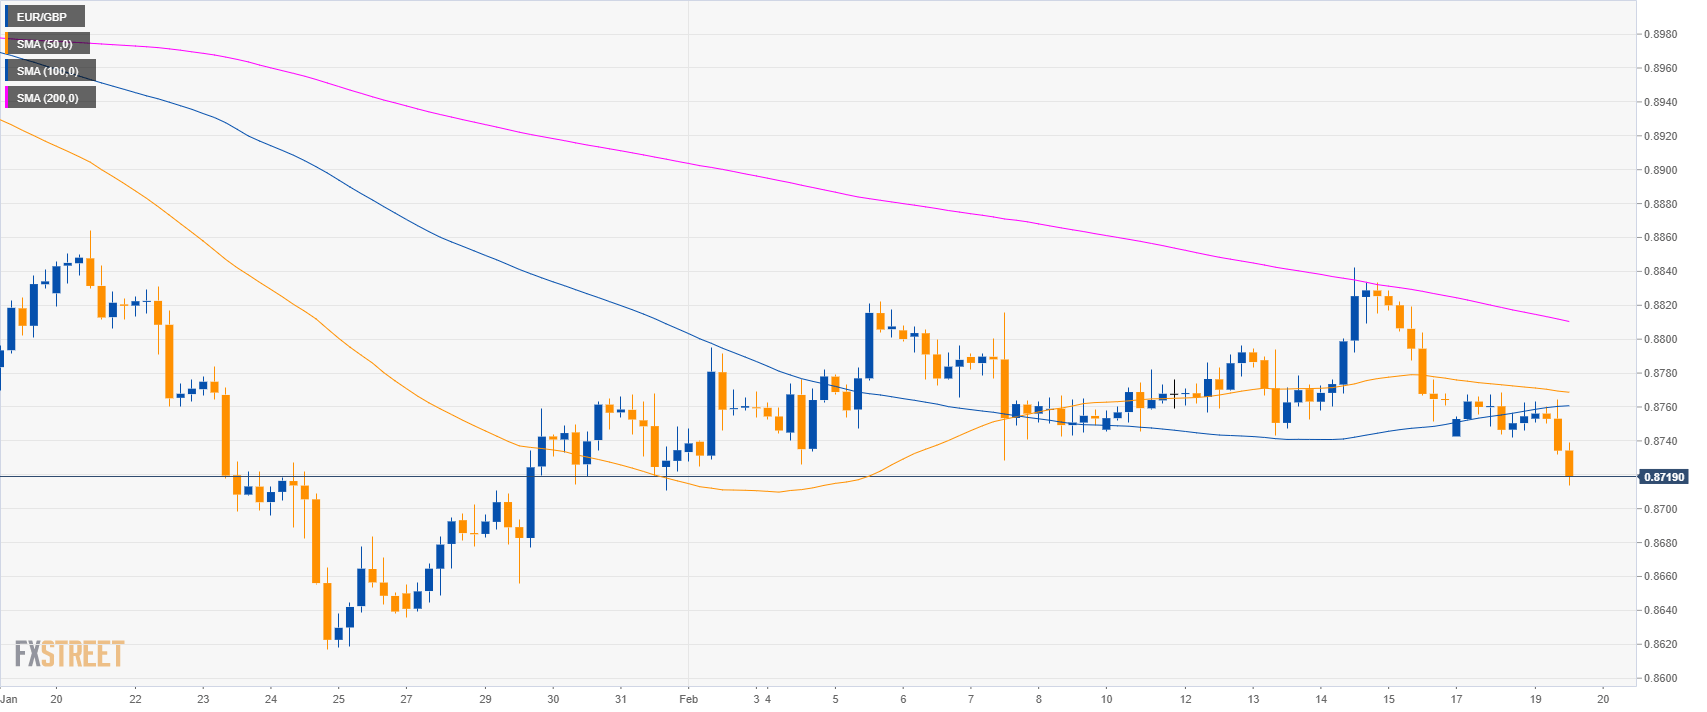
EUR/GBP 30-minute chart

  • EUR/GBP is trading below the main SMAs suggesting bearish momentum in the short-term.
  • EUR/GBP is testing 0.8720. A break below the level would lead to 0.8695 and 0.8660 level.
  • Resistance is seen at 0.8740 and 0.8760 level. 


Additional key levels

EUR/GBP

Overview:
    Today Last Price: 0.8718
    Today Daily change: -34 pips
    Today Daily change %: -0.39%
    Today Daily Open: 0.8752
Trends:
    Daily SMA20: 0.875
    Daily SMA50: 0.888
    Daily SMA100: 0.8856
    Daily SMA200: 0.8865
Levels:
    Previous Daily High: 0.8768
    Previous Daily Low: 0.8742
    Previous Weekly High: 0.8842
    Previous Weekly Low: 0.8743
    Previous Monthly High: 0.9119
    Previous Monthly Low: 0.8617
    Daily Fibonacci 38.2%: 0.8758
    Daily Fibonacci 61.8%: 0.8752
    Daily Pivot Point S1: 0.874
    Daily Pivot Point S2: 0.8728
    Daily Pivot Point S3: 0.8713
    Daily Pivot Point R1: 0.8766
    Daily Pivot Point R2: 0.8781
    Daily Pivot Point R3: 0.8793

Author

Flavio Tosti

Flavio Tosti

Independent Analyst


More from Flavio Tosti
Share:

Editor's Picks

EUR/USD: Breakdown below trading range support near 1.1770 comes into play

The EUR/USD pair opens with a bearish gap at the start of a new week as the US-Iran war-led global flight to safety boosts the US Dollar. Spot prices, however, lack follow-through selling and manage to hold above mid-1.1700s during the Asian session.

GBP/USD targets 1.3500 barrier near moving averages

GBP/USD rebounds from the daily losses, trading around 1.3450 during the Asian hours on Monday. The technical analysis of the daily chart indicates an ongoing bearish bias, as the pair trades within a descending channel pattern.

Gold retreats from $5,400; still up over 1% amid Middle East tensions

Gold retreats from the $5,400 neighborhood, or its highest level since late January, touched in the Asian session on Monday, though it manages to hold above the $5,300 round figure. The bright metal opened with a bullish gap of about $17 and rallied toward the $5,400 level as Asian traders hit their desks and reacted negatively to the weekend news of the US and Israel attacks on Iran, rushing for cover in Gold.

Top Crypto Losers: Tezos, Toncoin, and Polkadot at crucial levels amid US-Israel strike on Iran

Altcoins such as Tezos, Toncoin, and Polkadot rank among the worst hit cryptocurrencies over the last 24 hours amid the US and Israel's attack on Iran. Tezos and Toncoin are down to crucial support levels while Polkadot remains near a crucial resistance trendline, showcasing underlying strength.

The market is paying for insurance, not apocalypse

As expected, this morning felt less like a Monday market open and more like a fire drill. Futures screens flickered red. S&P contracts down almost 1%. Nasdaq off 1.2%. Brent leaped 13% through $80. Gold rose 1.6% toward $5350 before paring some gains. The dollar is strutting mildly. The Swiss franc is quietly doing what it always does in a storm, catching some safe-haven flows.

Starknet unveils strkBTC, shielded Bitcoin transactions on Ethereum Layer 2

Starknet, the Ethereum Layer 2 network developed by StarkWare, today announced strkBTC, a wrapped Bitcoin asset that introduces optional shielding while preserving full DeFi composability.