|

EUR/GBP Price Analysis: Slips to 11-day low, bearish channel on D1

  • EUR/GBP has charted a bearish channel over past two months. 
  • The pair has hit multi-week low and risks falling toward deeper supports. 

EUR/GBP is currently trading in the red at 0.8916, the lowest level since Nov. 12. 

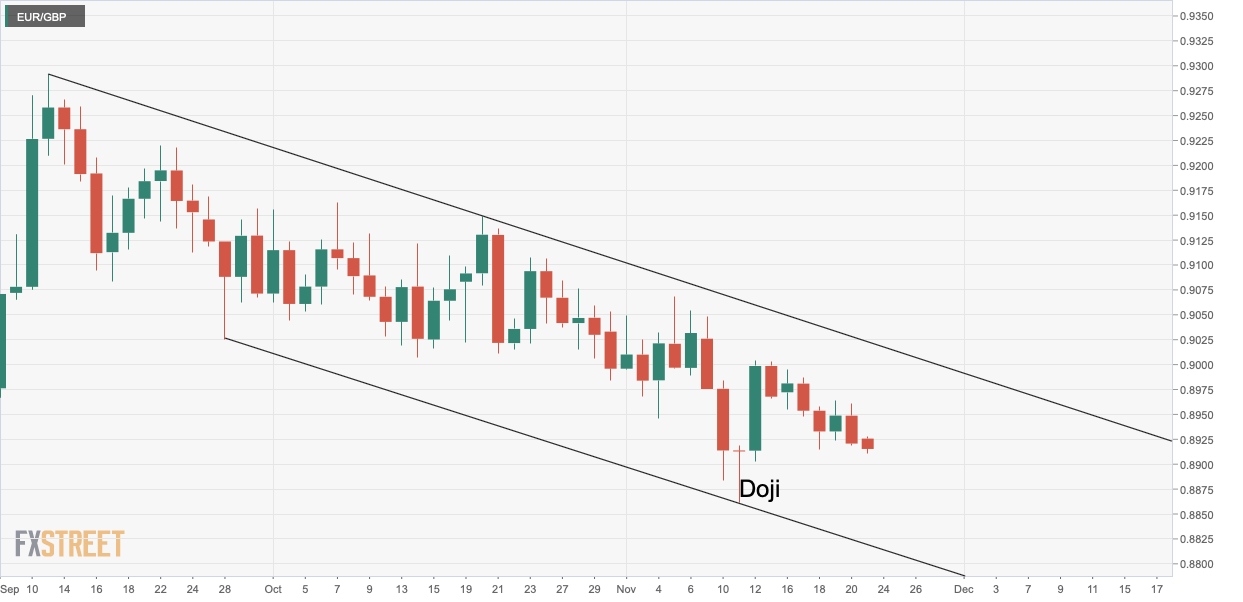
The pair is trapped in a bearish channel represented by trendlines connecting Sept. 11 and Oct. 20 highs and Sept. 28 and Nov. 11 lows, as seen on the daily chart

A bullish Doji reversal pattern confirmed by Nov. 12's move to 0.8994 had raised hopes for a channel breakout. However, the pullback to 0.8915 has invalidated the bullish Doji reversal and shifted risk in favor of a drop to September's low of 0.8866. 

On the higher side, the channel resistance, currently at 0.9028 is the level to beat for the bulls. 

Daily chart

Trend: Bearish

Technical levels

EUR/GBP

Overview
Today last price0.8916
Today Daily Change-0.0005
Today Daily Change %-0.06
Today daily open0.8921
 
Trends
Daily SMA200.8987
Daily SMA500.9059
Daily SMA1000.9043
Daily SMA2000.8946
 
Levels
Previous Daily High0.8961
Previous Daily Low0.8918
Previous Weekly High0.8995
Previous Weekly Low0.8915
Previous Monthly High0.9162
Previous Monthly Low0.8984
Daily Fibonacci 38.2%0.8935
Daily Fibonacci 61.8%0.8945
Daily Pivot Point S10.8906
Daily Pivot Point S20.8891
Daily Pivot Point S30.8863
Daily Pivot Point R10.8949
Daily Pivot Point R20.8976
Daily Pivot Point R30.8991

Author

Omkar Godbole

Omkar Godbole

FXStreet Contributor

Omkar Godbole, editor and analyst, joined FXStreet after four years as a research analyst at several Indian brokerage companies.

More from Omkar Godbole
Share:

Editor's Picks

EUR/USD struggles to regain momentum in the low1.1600s

EUR/USD is giving some signs of life in the aftermath of two severe days of losses on Wednesday, reclaiming the 1.1600 hurdle and above on the back of the resurgence of a mild selling bias around the US Dollar. Moving forward, the usual US weekly Claims will take centre stage on Thursday ahead of Friday’s crucial NFP data.
 

GBP/USD tests key moving averages as growth downgrade weighs

GBP/USD was nearly flat on Wednesday, edging up 0.08% to settle around 1.3370 in a quiet session. The pair has fallen sharply from its late-January high near 1.3870 and is now testing the 200-day Exponential Moving Average, with this week's one-week forex heatmap showing Pound Sterling as one of the worst performers against the US Dollar, down about 1.4% on the week.

Gold benefits from a retreating USD; reduced Fed rate cut bets cap gains

Gold attracts some buyers for the second consecutive day on Thursday amid a modest US Dollar pullback from an over three-month high, though it remains below the $5,200 mark. Wednesday's upbeat US macro data further tempered hopes for three rate cuts by the Fed in 2026. Furthermore, escalating Middle East tensions might continue to benefit the USD's status as the global reserve currency and contribute to capping the bullion.

Morgan Stanley files amended S-1 for spot Bitcoin ETF

Morgan Stanley submitted an amended S-1 filing to the US Securities and Exchange Commission on Wednesday, providing additional details on its proposed Bitcoin exchange-traded fund.

First Venezuela, now Iran: The US-China energy war escalates

At first glance, the latest escalation involving the United States with both Iran and Venezuela looks like another chapter in a long-running geopolitical story. But viewed through a broader strategic lens, something else may be unfolding: Energy.

Bittensor extends recovery despite retail demand slump

Bittensor, a leading Artificial Intelligence token, is aging up above $190 at the time of writing on Wednesday. Steady price increases characterise the broader crypto market, with Bitcoin holding above $71,000 and Ethereum above $2,000.