|

EUR/GBP Price Analysis: Slides to 0.8800 inside weekly bullish channel on BOE chatters

  • EUR/GBP consolidates biggest daily gains in two weeks inside bullish chart formation.
  • Reports that BOE could extend bond-buying triggered GBP’s immediate strength.
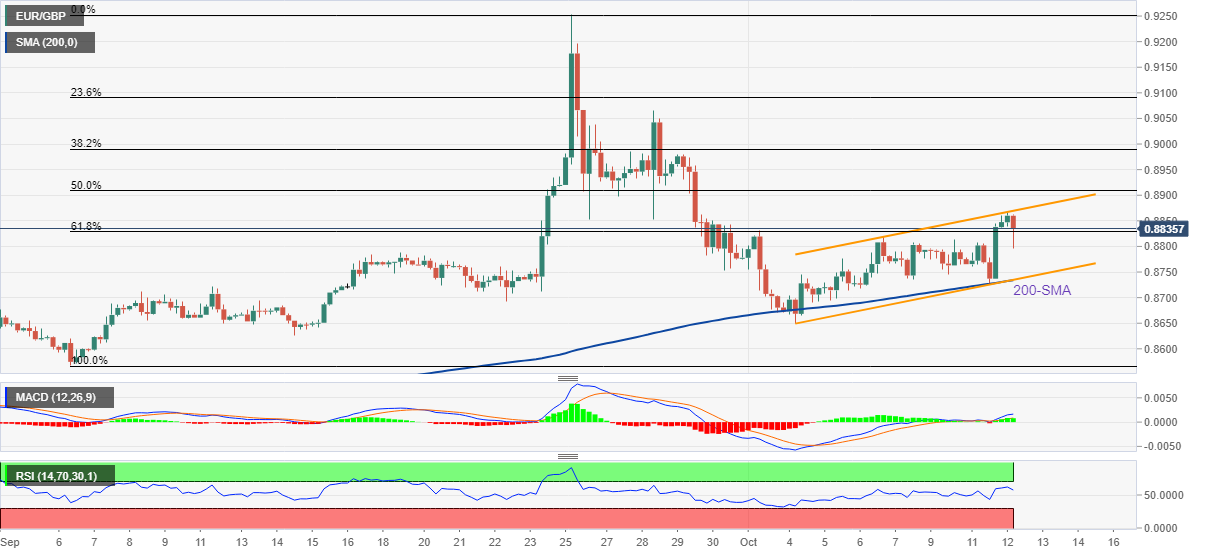
  • 200-SMA adds strength to 0.8735 support confluence, oscillators also favor buyers.

EUR/GBP portrays the British Pound’s (GBP) immediate run-up on the Financial Times (FT) report that the Bank of England (BOE) is likely to extend the bond-buying program. In doing so, the cross-currency pair reverses from the upper line of a weekly bullish channel while flashing 0.8796 as the daily low, around 0.8825 by the press time of early Wednesday morning in Europe.

“The Bank of England has signaled privately to bankers that it could extend its emergency bond-buying program past this Friday’s deadline, according to people briefed on the discussions, even as Governor Andrew Bailey warned pension funds that they “have three days left” before the support ends,” mentioned FT.

Although the recent news suggests further downside of the EUR/GBP pair, a convergence of the 200-SMA and the stated bullish channel’s bottom, around 0.8735, appears a tough nut to crack for the bears.

Following that, a slump towards refreshing the monthly low, currently around 0.8650, can’t be ruled out.

It should be noted that the MACD and the RSI (14) are both in favor of the quote’s further upside. That said, the aforementioned channel’s top, close to 0.8870, guards the EUR/GBP pair’s immediate rebound.

Also acting as an upside filter is the 50% Fibonacci retracement level of September month upside, near 0.8910, a break of which will direct the EUR/GBP bears towards the 0.9000 psychological magnet.

EUR/GBP: Four-hour chart

Trend: Limited downside expected

Additional impotant levels

Overview
Today last price0.8816
Today Daily Change-0.0035
Today Daily Change %-0.40%
Today daily open0.8851
 
Trends
Daily SMA200.8791
Daily SMA500.8628
Daily SMA1000.8576
Daily SMA2000.848
 
Levels
Previous Daily High0.886
Previous Daily Low0.8725
Previous Weekly High0.8831
Previous Weekly Low0.8649
Previous Monthly High0.9254
Previous Monthly Low0.8566
Daily Fibonacci 38.2%0.8809
Daily Fibonacci 61.8%0.8777
Daily Pivot Point S10.8764
Daily Pivot Point S20.8677
Daily Pivot Point S30.8629
Daily Pivot Point R10.8899
Daily Pivot Point R20.8947
Daily Pivot Point R30.9034

Author

Anil Panchal

Anil Panchal

FXStreet

Anil Panchal has nearly 15 years of experience in tracking financial markets. With a keen interest in macroeconomics, Anil aptly tracks global news/updates and stays well-informed about the global financial moves and their implications.

More from Anil Panchal
Share:

Editor's Picks

EUR/USD remains heavy near 1.1600 after hot EU inflation data

EUR/USD remains heavily offered near 1.1600, six-week lows, in the European session on Tuesday. The pair fails to find any inspiration from a surprise pick up in Eurozone inflation for February, as the US Dollar continues to attract safe haven flows amid escalating geopolitical tensions in the Middle East. 

GBP/USD attacks 1.3300, refreshing three-month lows

GBP/USD is deep in the red near 1.3300, accelerating its downside to renew three-month lows in European trading on Tuesday. The ongoing escalation in the Iran war, combined with rising Oil prices, weighs negatively on the higher-yielding Pound Sterling as the US Dollar capitalizes on increased haven demand.

Gold falls below $5,300 as stronger USD counter Middle East woes

Gold attracts some intraday selling and falls below $5,300 on Tuesday. The US Dollar climbs to a fresh high since January 20 and turns out to be a key factor exerting downward pressure on the commodity. However, concerns about a broader regional conflict in the Middle East continue to weigh on investors' sentiment and underpin demand for the traditional safe-haven bullion.

Stellar risks deeper losses as derivatives metrics turn negative

Stellar is trading red below $0.16 at the time of writing on Tuesday, after a slight recovery the previous day. Weakening derivatives data caps the recovery, while an unfavorable technical outlook projects a deeper correction for the XLM token in the upcoming days.

Middle East conflict ramps up a gear as energy price spike rips through markets

It’s another risk off day as geopolitical headwinds continue to batter financial markets. Although markets calmed during the US session and US stocks managed to post gains on Monday, this has not fed through to the European session, and stocks and bonds are sharply lower for a second day.

Hyperliquid Price Forecast: HYPE rises on commodities demand amid US-Iran war

Hyperliquid (HYPE) steadies above $33 at press time on Tuesday, marking its fourth consecutive day of recovery in a broadly volatile market due to the ongoing US-Israel strikes on Iran.