EUR/GBP Price Analysis: Further upside hinges on 0.9160 breakout


  • EUR/GBP retreats after refreshing two-year high, sluggish of late.
  • Bulls need validation from the key Fibonacci retracement hurdle.
  • Sellers could take risks unless the quote drops below 0.8715.
  • Bullish bias fades amid overbought RSI, nearness to key resistances.

EUR/GBP struggles to extend the latest run-up to the highest levels since September 2020, retreating to 0.9133 heading into Monday’s European session. In doing so, the cross-currency pair justifies the overbought RSI (14), as well as the importance of the Fibonacci retracement levels of the March 2020 to March 2022 downturn.

That said, the quote’s latest pullback, however, needs validation from the 61.8% Fibonacci retracement level of the 0.9000 psychological magnet to extend the south-run.

Following that, the 50% Fibonacci retracement level near 0.8850 can entertain the EUR/GBP bears before directing them to the tops marked during April 2021 and June 2022, around 0.8720.

Alternatively, the EUR/GBP prices need a weekly closing beyond the 78.6% Fibonacci retracement level near 0.9215-20 to keep the buyers hopeful.

In that case, the late March 2020 high near 0.9390 could offer an intermediate halt during the run-up to the year 2020 peak surrounding the 0.9500 mark.

To sum up, EUR/GBP is likely to remain firmer but the short-term pullback can’t be ruled out.

EUR/GBP: Weekly chart

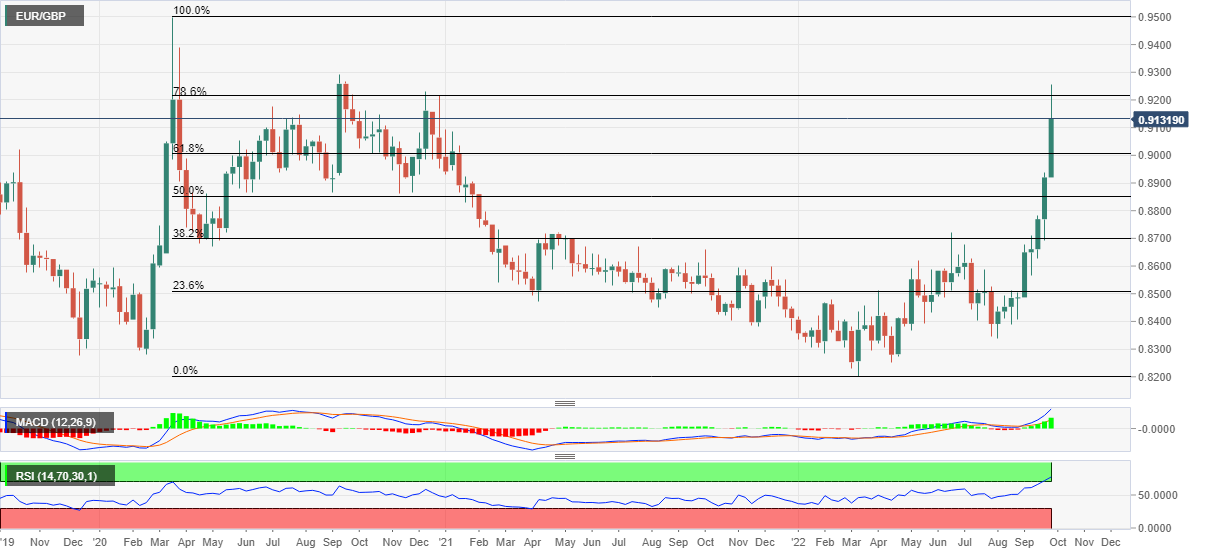
Trend: Pullback expected

Additional important levels

Overview
Today last price 0.914
Today Daily Change 0.0220
Today Daily Change % 2.47%
Today daily open 0.892
 
Trends
Daily SMA20 0.8685
Daily SMA50 0.8539
Daily SMA100 0.8539
Daily SMA200 0.8457
 
Levels
Previous Daily High 0.8937
Previous Daily Low 0.8711
Previous Weekly High 0.8937
Previous Weekly Low 0.8692
Previous Monthly High 0.8653
Previous Monthly Low 0.834
Daily Fibonacci 38.2% 0.8851
Daily Fibonacci 61.8% 0.8797
Daily Pivot Point S1 0.8775
Daily Pivot Point S2 0.8631
Daily Pivot Point S3 0.855
Daily Pivot Point R1 0.9001
Daily Pivot Point R2 0.9081
Daily Pivot Point R3 0.9226


Share: Feed news

Information on these pages contains forward-looking statements that involve risks and uncertainties. Markets and instruments profiled on this page are for informational purposes only and should not in any way come across as a recommendation to buy or sell in these assets. You should do your own thorough research before making any investment decisions. FXStreet does not in any way guarantee that this information is free from mistakes, errors, or material misstatements. It also does not guarantee that this information is of a timely nature. Investing in Open Markets involves a great deal of risk, including the loss of all or a portion of your investment, as well as emotional distress. All risks, losses and costs associated with investing, including total loss of principal, are your responsibility. The views and opinions expressed in this article are those of the authors and do not necessarily reflect the official policy or position of FXStreet nor its advertisers. The author will not be held responsible for information that is found at the end of links posted on this page.

If not otherwise explicitly mentioned in the body of the article, at the time of writing, the author has no position in any stock mentioned in this article and no business relationship with any company mentioned. The author has not received compensation for writing this article, other than from FXStreet.

FXStreet and the author do not provide personalized recommendations. The author makes no representations as to the accuracy, completeness, or suitability of this information. FXStreet and the author will not be liable for any errors, omissions or any losses, injuries or damages arising from this information and its display or use. Errors and omissions excepted.

The author and FXStreet are not registered investment advisors and nothing in this article is intended to be investment advice.

Recommended content


Recommended content

Editors’ Picks

AUD/USD failed just ahead of the 200-day SMA

AUD/USD failed just ahead of the 200-day SMA

Finally, AUD/USD managed to break above the 0.6500 barrier on Wednesday, extending the weekly recovery, although its advance faltered just ahead of the 0.6530 region, where the key 200-day SMA sits.

AUD/USD News

EUR/USD met some decent resistance above 1.0700

EUR/USD met some decent resistance above 1.0700

EUR/USD remained unable to gather extra upside traction and surpass the 1.0700 hurdle in a convincing fashion on Wednesday, instead giving away part of the weekly gains against the backdrop of a decent bounce in the Dollar.

EUR/USD News

Gold keeps consolidating ahead of US first-tier figures

Gold keeps consolidating ahead of US first-tier figures

Gold finds it difficult to stage a rebound midweek following Monday's sharp decline but manages to hold above $2,300. The benchmark 10-year US Treasury bond yield stays in the green above 4.6% after US data, not allowing the pair to turn north.

Gold News

Bitcoin price could be primed for correction as bearish activity grows near $66K area

Bitcoin price could be primed for correction as bearish activity grows near $66K area

Bitcoin (BTC) price managed to maintain a northbound trajectory after the April 20 halving, despite bold assertions by analysts that the event would be a “sell the news” situation. However, after four days of strength, the tables could be turning as a dark cloud now hovers above BTC price.

Read more

Bank of Japan's predicament: The BOJ is trapped

Bank of Japan's predicament: The BOJ is trapped

In this special edition of TradeGATEHub Live Trading, we're joined by guest speaker Tavi @TaviCosta, who shares his insights on the Bank of Japan's current predicament, stating, 'The BOJ is Trapped.' 

Read more

Forex MAJORS

Cryptocurrencies

Signatures