|

EUR/GBP Price Analysis: Dives amid recession fears, post-BoE hike

  • Pound gains ground as BoE boosts rates; EUR/GBP pair hits 0.8566, sparking recession concerns.
  • The technical outlook suggests a prolonged EUR/GBP downtrend as cross falls below the 20-day EMA.
  • Buyers eye EUR/GBP recovery above 0.8600; the critical hurdle lies at 50-day EMA at 0.8657.

The EUR/GBP dropped for the second straight day following Thursday’s Bank of England (BoE) monetary policy decision to raise rates by 50 basis points (bps) which bolstered the Pound Sterling (GBP) against the Euro (EUR). In addition, a deceleration in business activity in the Eurozone (EU) and the UK increased recession fears. Still, upbeat retail sales in the UK exacerbated a leg-down in the EUR/GBP. At the time of writing, the EUR/GBP exchanges hands at 0.8566 after hitting a high of 0.8607.

EUR/GBP Price Analysis: Technical outlook

Given the fundamental backdrop, the EUR/GBP is set to extend its downtrend. Also, the pair crossed below the 20-day Exponential Moving Average (EMA) at 0.8593, a bearish signal that exacerbated the cross fall toward daily lows reached at around 0.8535 before stabilizing at current exchange rates.

Sellers will need the EUR/GBP printing a daily close below the June 22 daily low of 0.8569 to cement the downtrend. That would put at risk support levels like the current two-day low of 0.8535, followed by the weekly low of 0.85255, before challenging the year-to-date (YTD) low of 0.8518.

Otherwise, EUR/GBP buyers would remain hopeful of cracking the 0.8600 figure, though firstly, they need to conquer the 20-day EMA. Upside risks above the 0.86 figure lie at a June 22 high of 0.8639, with buyers eyeing the 50-day EMA as the next ceiling level at 0.8657.

EUR/GBP Price Action – Daily chart
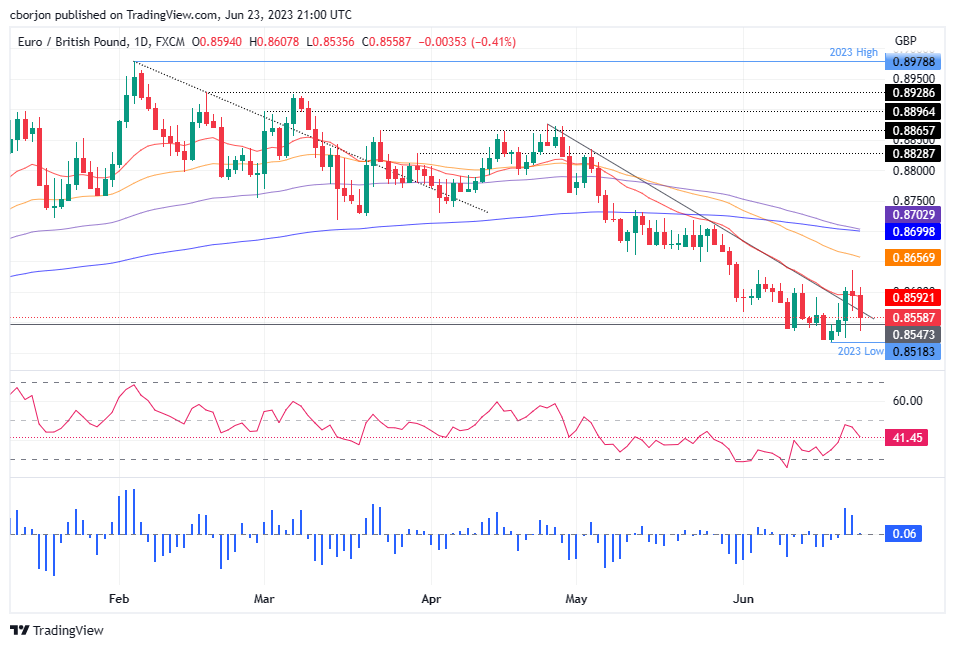
EUR/GBP Daily chart

EUR/GBP

Overview
Today last price0.8566
Today Daily Change-0.0028
Today Daily Change %-0.33
Today daily open0.8594
 
Trends
Daily SMA200.8592
Daily SMA500.8691
Daily SMA1000.8759
Daily SMA2000.8751
 
Levels
Previous Daily High0.8636
Previous Daily Low0.8574
Previous Weekly High0.8613
Previous Weekly Low0.8522
Previous Monthly High0.8835
Previous Monthly Low0.8583
Daily Fibonacci 38.2%0.8598
Daily Fibonacci 61.8%0.8612
Daily Pivot Point S10.8567
Daily Pivot Point S20.8539
Daily Pivot Point S30.8504
Daily Pivot Point R10.8629
Daily Pivot Point R20.8664
Daily Pivot Point R30.8692

Author

Christian Borjon Valencia

Markets analyst, news editor, and trading instructor with over 14 years of experience across FX, commodities, US equity indices, and global macro markets.


More from Christian Borjon Valencia
Share:

Editor's Picks

GBP/USD clings to 1.3500 amid marginal losses

GBP/USD alternates gains with losses around the 1.3500 neighbourhood on Tuesday. Indeed, Cable struggles to further extend its incipient recovery in a context of continuous instability in the Middle East and modest gains in the Greenback.

EUR/USD alternates gains with losses near 1.1540

EUR/USD navigates a tight range near 1.1550 in the latter part of Tuesday’s NA session. The US Dollar’s vacillating price action accompanies the pair while market participants gear up for the crucial US inflation data due on Wednesday.

Gold loses the grip below $4,400

Gold retreats from its earlier tops and briefly revisited the $4,350 region per troy ounce on Tuesday. The yellow metal’s modest retracement follows lacklustre gains in the US Dollar and declining US Treasury yields across the curve, all amid steady uncertainty from the geopolitical landscape.

Shiba Inu Price Forecast: SHIB extends sell-off despite surging futures Open Interest
Shiba Inu (SHIB) maintains a bearish outlook on Tuesday, as it edges lower at $0.00000450. This marks the seventh day the meme coin has sustained a sell-off, weighed down by a weak technical structure. Shiba Inu derivatives continue to gain momentum, with perpetual futures Open Interest (OI) rising to 11.08 trillion SHIB on Tuesday, from 10.46 trillion the day before.
The inflation narrative is still way more important than the employment story
Core bonds sold off yesterday with the belly of the curve slightly underperforming in the US while European curves showed more of a bear flattening. Daily changes on the US curve varied between +4.7 bps (2-yr) and +6.4 bps (7-yr).
9-3: Is the Federal Reserve’s vote tally Warsh's new forward guidance?
The rate did not move. Neither did the statement, and that’s the more interesting fact. Set the July 29 Federal Open Market Committee (FOMC) statement beside the one issued on June 17, and the two documents are identical apart from a single verb and a paragraph at the bottom naming three dissenters.













