|

EUR/GBP Price Analysis: Bounces off lower channel line and continues modest gains

  • EUR/GBP has rebounded after touching the lower channel line of its rising channel. 
  • The chart suggests a mild bullish bias as price slowly makes steps higher. 

EUR/GBP bounces off the lower channel line of its shallow rising channel and pushes higher. 

Price continues to respect the confines of the recovery channel which began at the August 30 lows. Little by little, it climbs higher, suggesting a new short-term uptrend is taking root. 

EUR/GBP 4-hour Chart 

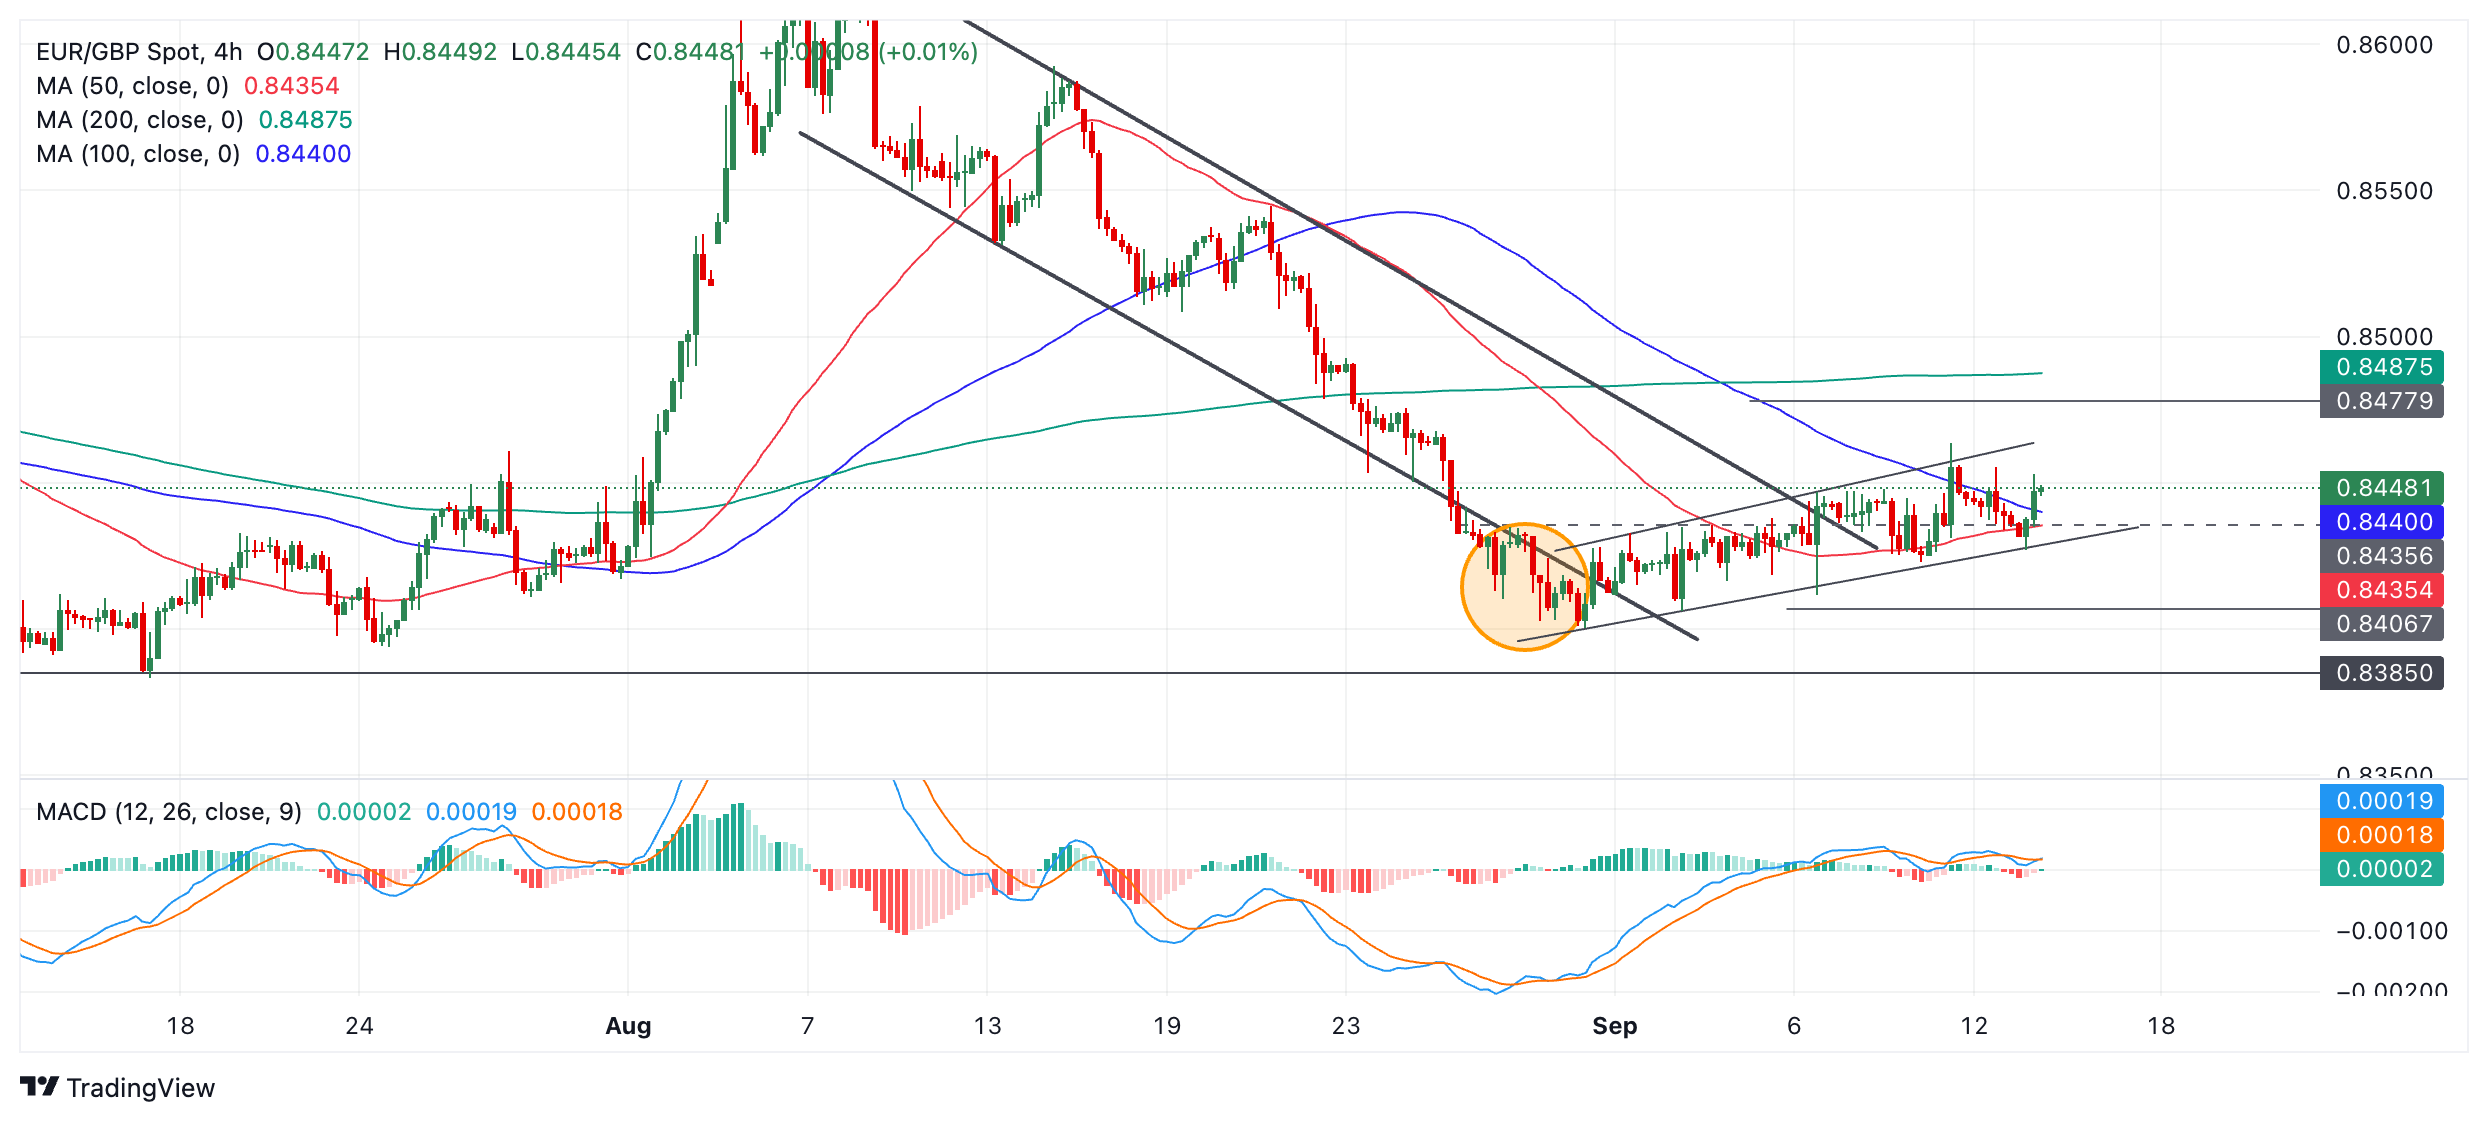
The Moving Average Convergence Divergence (MACD) momentum indicator stays above the zero line indicating a mild bullishness to price dynamics. 

A close above the 0.8464 high (September 11 high) would be required to confirm an upside breakout from the channel. Such a move would likely reach about 0.8477, the 0.618 Fibonacci (Fib) extension of the height of the channel extrapolated higher. 

Bullish signs now marginally outweigh bearish. For starters EUR/GBP keeps rising within a bullish channel, secondly it has now worked its way through the previous falling channel, and finally the exhaustion break during August (orange shaded circle) – when it accelerated to the downside – is a bullish reversal sign. 

The main bearish sign is the relative shallowness of the rising channel in comparison to the much steeper previous bear move. 

A close below 0.8423 (September 10 low) would pave the way for further weakness to a downside target at 0.8406, the 0.618 Fib extension lower.

Author

Joaquin Monfort

Joaquin Monfort is a financial writer and analyst with over 10 years experience writing about financial markets and alt data. He holds a degree in Anthropology from London University and a Diploma in Technical analysis.

More from Joaquin Monfort
Share:

Editor's Picks

EUR/USD looks to regain the 200-day SMA

EUR/USD regains some balance and trade just above 1.1600 the figure ahead of the opening bell in Asia. The pair initially dipped to the 1.1530 zone for the first time since November, always following the stronger US Dollar and the marked flight-to-safety in the context of the ongoing Middle East crisis
 

GBP/USD slips below key averages as geopolitical risks mount

GBP/USD fell about 0.35% on Tuesday, settling around 1.3350 after slipping below the 200-day Exponential Moving Average for the first time since early December. The pair has pulled back sharply from its late-January high near 1.3870, shedding over 500 pips in a series of lower highs and lower lows. 

Gold falls to near $5,100 as inflation fears weigh amidst Middle East conflict

Gold price faces some selling pressure near $5,100 during the early Asian session on Wednesday. The precious metal falls amid a renewed US Dollar demand and dimming prospects for US rate cuts. The US ISM Services Purchasing Managers Index report will be published later on Wednesday. 

Ethereum: Whales step up buying as short positions contract

After holding firm heading into the last weekend, Ethereum whales have returned to action, pouncing on the volatility stemming from escalating military actions between the US and Iran.

Energy shock 2.0: Why rising Gas prices could hit the Euro

Even without a confirmed, sustained disruption, the mere risk to a key global energy chokepoint is enough to inject a significant premium into European Gas markets. And for the Euro, that matters.

Ripple falters amid sell-off jitters and negative funding rates

Ripple (XRP) has come under pressure, drifting lower to $1.35 at the time of writing on Tuesday. The over 2% correction looks poised to erase the previous day’s gains, which lifted the remittance token to $1.42.