EUR/GBP Price Analysis: Bounces off 100-DMA as ECB rate hike looms


  • EUR/GBP picks up bids to consolidate the biggest daily loss in three weeks.
  • Bearish oscillators, sustained trading below one-week-old descending trend line keep sellers hopeful.
  • Bears could aim for 61.8% Fibonacci retracement, 200-DMA on breaking immediate support.

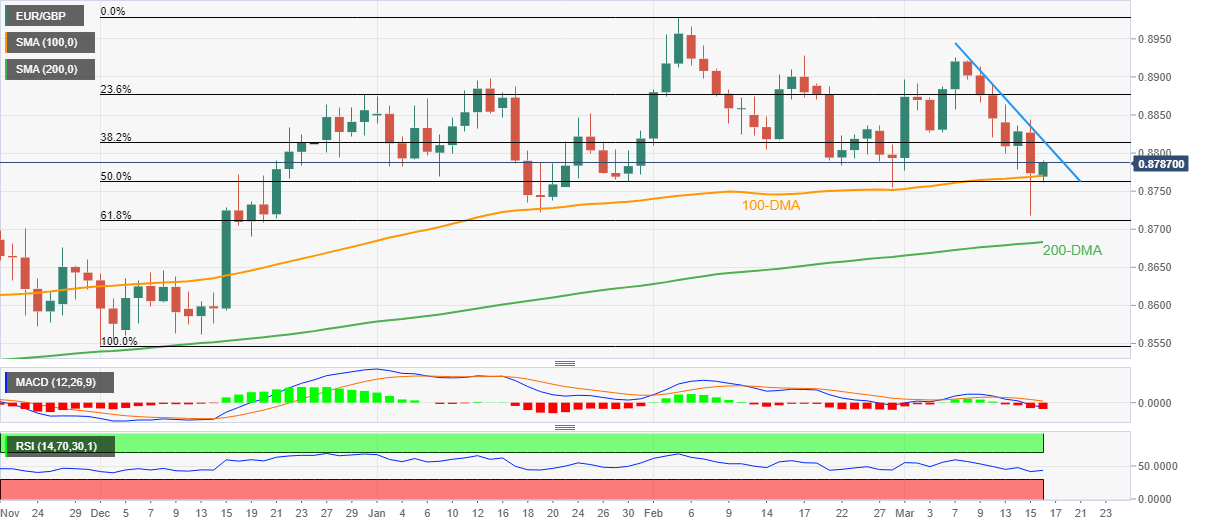
EUR/GBP renews intraday high near 0.8790 as it extends the late Wednesday’s bounce off the lowest levels since December 2022 heading into Thursday’s European session. In doing so, the cross-currency pair rebounds from the 100-DMA while paring the biggest daily loss in three weeks ahead of the key European Central Bank’s (ECB) Monetary Policy Meeting.

Although the key moving average allows buyers to return to the desk, their dominance remains doubtful as the MACD flashes bearish MACD signals. Also challenging the upside bias are the downbeat conditions of the RSI (14) line, not oversold, as well as a one-week-old descending trend line, around 0.8815.

Even if the EUR/GBP recovery crosses the 0.8815 immediate hurdle, the 0.8900 threshold and 0.8930 resistance level can challenge the pair’s further advances before directing bulls towards the yearly high marked in February near 0.8980.

Meanwhile, pullback moves need a daily closing below the 100-DMA support of 0.8770, as well as the 50% Fibonacci retracement level of the pair’s December 2022 to February 2023 upside near 0.8760, to convince sellers.

Following that, the 61.8% Fibonacci retracement, also known as the golden Fibonacci ratio, could challenge the EUR/GBP bears around 0.8710 ahead of highlighting the 200-DMA support of 0.8683.

EUR/GBP: Daily chart

Trend: Limited upside expected

Additional important levels

Overview
Today last price 0.8782
Today Daily Change 0.0008
Today Daily Change % 0.09%
Today daily open 0.8774
 
Trends
Daily SMA20 0.8845
Daily SMA50 0.8839
Daily SMA100 0.8769
Daily SMA200 0.8682
 
Levels
Previous Daily High 0.8844
Previous Daily Low 0.8718
Previous Weekly High 0.8925
Previous Weekly Low 0.8821
Previous Monthly High 0.8979
Previous Monthly Low 0.8755
Daily Fibonacci 38.2% 0.8766
Daily Fibonacci 61.8% 0.8796
Daily Pivot Point S1 0.8713
Daily Pivot Point S2 0.8653
Daily Pivot Point S3 0.8588
Daily Pivot Point R1 0.8839
Daily Pivot Point R2 0.8904
Daily Pivot Point R3 0.8964


Share: Feed news

Information on these pages contains forward-looking statements that involve risks and uncertainties. Markets and instruments profiled on this page are for informational purposes only and should not in any way come across as a recommendation to buy or sell in these assets. You should do your own thorough research before making any investment decisions. FXStreet does not in any way guarantee that this information is free from mistakes, errors, or material misstatements. It also does not guarantee that this information is of a timely nature. Investing in Open Markets involves a great deal of risk, including the loss of all or a portion of your investment, as well as emotional distress. All risks, losses and costs associated with investing, including total loss of principal, are your responsibility. The views and opinions expressed in this article are those of the authors and do not necessarily reflect the official policy or position of FXStreet nor its advertisers. The author will not be held responsible for information that is found at the end of links posted on this page.

If not otherwise explicitly mentioned in the body of the article, at the time of writing, the author has no position in any stock mentioned in this article and no business relationship with any company mentioned. The author has not received compensation for writing this article, other than from FXStreet.

FXStreet and the author do not provide personalized recommendations. The author makes no representations as to the accuracy, completeness, or suitability of this information. FXStreet and the author will not be liable for any errors, omissions or any losses, injuries or damages arising from this information and its display or use. Errors and omissions excepted.

The author and FXStreet are not registered investment advisors and nothing in this article is intended to be investment advice.

Recommended content


Recommended content

Editors’ Picks

EUR/USD climbs to 10-day highs above 1.0700

EUR/USD climbs to 10-day highs above 1.0700

EUR/USD gained traction and rose to its highest level in over a week above 1.0700 in the American session on Tuesday. The renewed US Dollar weakness following the disappointing PMI data helps the pair stretch higher.

EUR/USD News

GBP/USD extends recovery beyond 1.2400 on broad USD weakness

GBP/USD extends recovery beyond 1.2400 on broad USD weakness

GBP/USD gathered bullish momentum and extended its daily rebound toward 1.2450 in the second half of the day. The US Dollar came under heavy selling pressure after weaker-than-forecast PMI data and fueled the pair's rally. 

GBP/USD News

Gold rebounds to $2,320 as US yields turn south

Gold rebounds to $2,320 as US yields turn south

Gold reversed its direction and rose to the $2,320 area, erasing a large portion of its daily losses in the process. The benchmark 10-year US Treasury bond yield stays in the red below 4.6% following the weak US PMI data and supports XAU/USD.

Gold News

Here’s why Ondo price hit new ATH amid bearish market outlook Premium

Here’s why Ondo price hit new ATH amid bearish market outlook

Ondo price shows no signs of slowing down after setting up an all-time high (ATH) at $1.05 on March 31. This development is likely to be followed by a correction and ATH but not necessarily in that order.

Read more

Germany’s economic come back

Germany’s economic come back

Germany is the sick man of Europe no more. Thanks to its service sector, it now appears that it will exit recession, and the economic future could be bright. The PMI data for April surprised on the upside for Germany, led by the service sector.

Read more

Forex MAJORS

Cryptocurrencies

Signatures