EUR/CHF steadies after bullish gap with focus on ECB interest rate decision
- EUR/CHF trades sideways after opening with a bullish gap, lacking follow-through amid pre-ECB event caution.
- Traders refrain from large directional bets before Eurozone GDP and CPI data, as well as Thursday’s ECB monetary policy decision.
- Technical outlook stays bearish below 0.9280, though a breakout above this zone could trigger a recovery toward 0.9350-0.9400.

The EUR/CHF cross opened the week with a mild bullish gap on Monday but failed to extend gains, settling into a sideways pattern. At the time of writing, EUR/CHF trades near 0.9264, its highest level since October 17th, after briefly sliding to an 11-month low around 0.9205 last week.
Traders may refrain from taking large directional bets ahead of key Eurozone events, with Gross Domestic Product (GDP) data and the European Central Bank (ECB) interest rate decision both due on Thursday, followed by the Consumer Price Index (CPI) on Friday.
The ECB is widely expected to keep its benchmark rate unchanged at 2.00% for a third consecutive meeting, as recent Purchasing Managers Index (PMI) figures and stable inflation suggest a steady recovery in the Eurozone. According to the latest BHH report, interest-rate swap markets assign roughly 50% odds of one additional 25-basis-point (bps) rate cut by the central bank within the next twelve months, with the policy rate expected to bottom near 1.75%.
Meanwhile, from Switzerland, no major economic releases are scheduled this week except the ZEW Survey – Expectations (October) due on Wednesday, which may provide some insight into investor sentiment toward the Swiss economy.
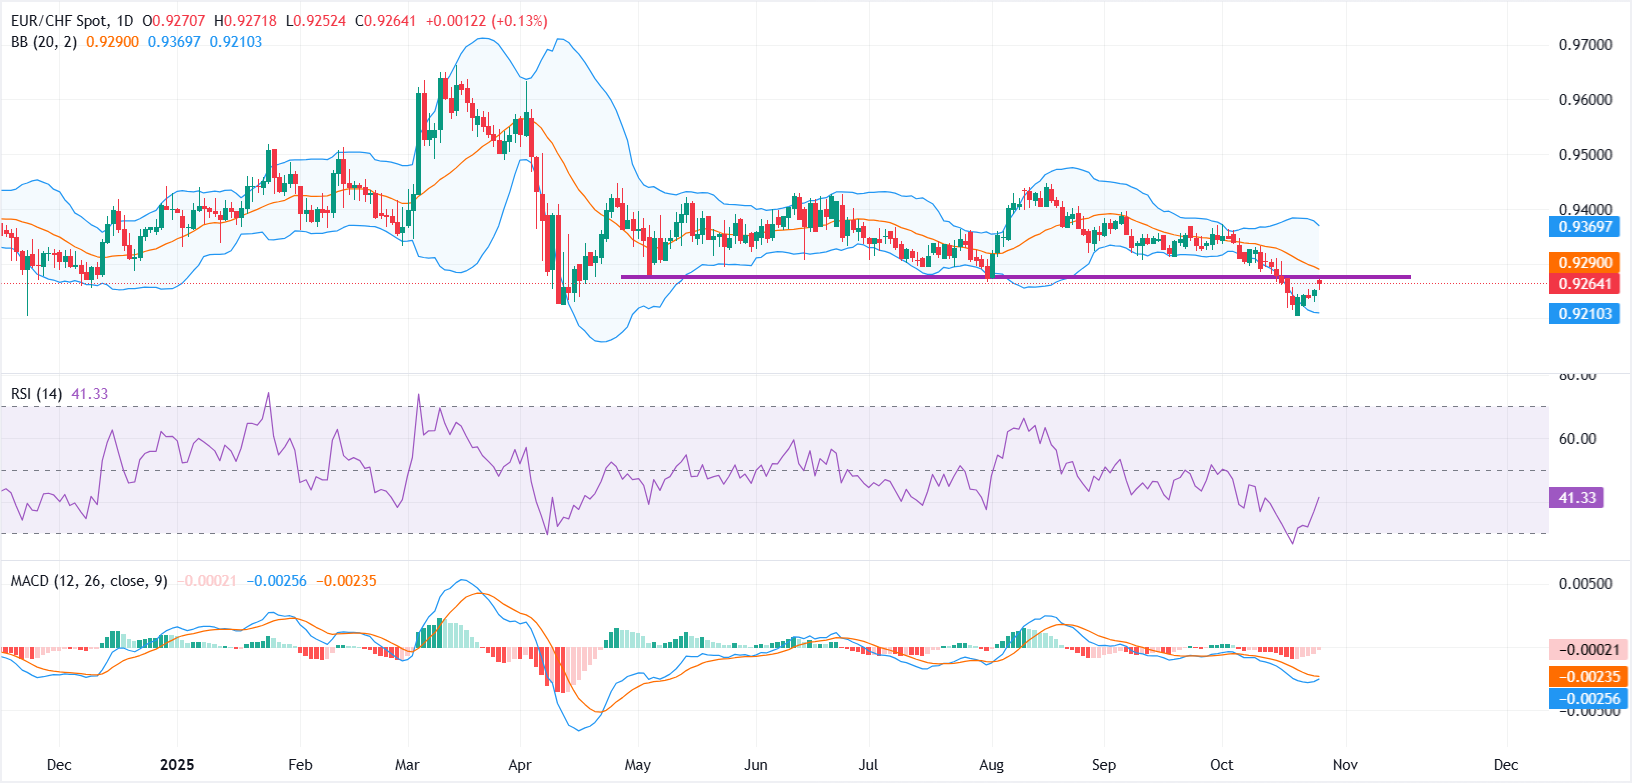
From a technical perspective, the daily chart highlights a break-and-retest pattern near the 0.9270-0.9280 zone, representing the lower boundary of a multi-month range that has turned into immediate resistance.
Unless bulls manage a sustained breakout above this barrier, the downside bias remains intact, leaving the pair exposed to further losses toward 0.9210 and beyond. A daily close above 0.9280, however, would mark a shift back into the prior consolidation range, potentially opening the path toward 0.9350-0.9400.
The Bollinger Bands show contracting volatility after last week’s decline, with prices hovering near the midline. The Relative Strength Index (RSI) stands around 41, showing a mild recovery from oversold territory but still below the neutral 50 line, keeping short-term sentiment bearish.
The Moving Average Convergence Divergence (MACD) remains in negative territory, though the narrowing histogram indicates weakening downside momentum and the potential for short-term stabilization.
Economic Indicator
ECB Main Refinancing Operations Rate
One of the three key interest rates set by the European Central Bank (ECB), the main refinancing operations rate is the interest rate the ECB charges to banks for one-week long loans. It is announced by the European Central Bank at its eight scheduled annual meetings. If the ECB expects inflation to rise, it will increase its interest rates to bring it back down to its 2% target. This tends to be bullish for the Euro (EUR), since it attracts more foreign capital inflows. Likewise, if the ECB sees inflation falling it may cut the main refinancing operations rate to encourage banks to borrow and lend more, in the hope of driving economic growth. This tends to weaken the Euro as it reduces its attractiveness as a place for investors to park capital.
Read more.Next release: Thu Oct 30, 2025 13:15
Frequency: Irregular
Consensus: 2.15%
Previous: 2.15%
Source: European Central Bank
Author

Vishal Chaturvedi
FXStreet
I am a macro-focused research analyst with over four years of experience covering forex and commodities market. I enjoy breaking down complex economic trends and turning them into clear, actionable insights that help traders stay ahead of the curve.


