|

EUR/AUD Price Forecast: Short-term trend probably reversing and heading lower

  • EUR/AUD is probably reversing its trend and starting a new downtrend. 
  • After it peaked on October 31 it formed a bearish candlestick reversal pattern which is currently playing out.  

EUR/AUD has started to fall after forming a bearish Shooting Star Japanese candlestick reversal pattern (red-shaded rectangle on chart below) as it peaked on October 31. 

EUR/AUD Daily Chart 


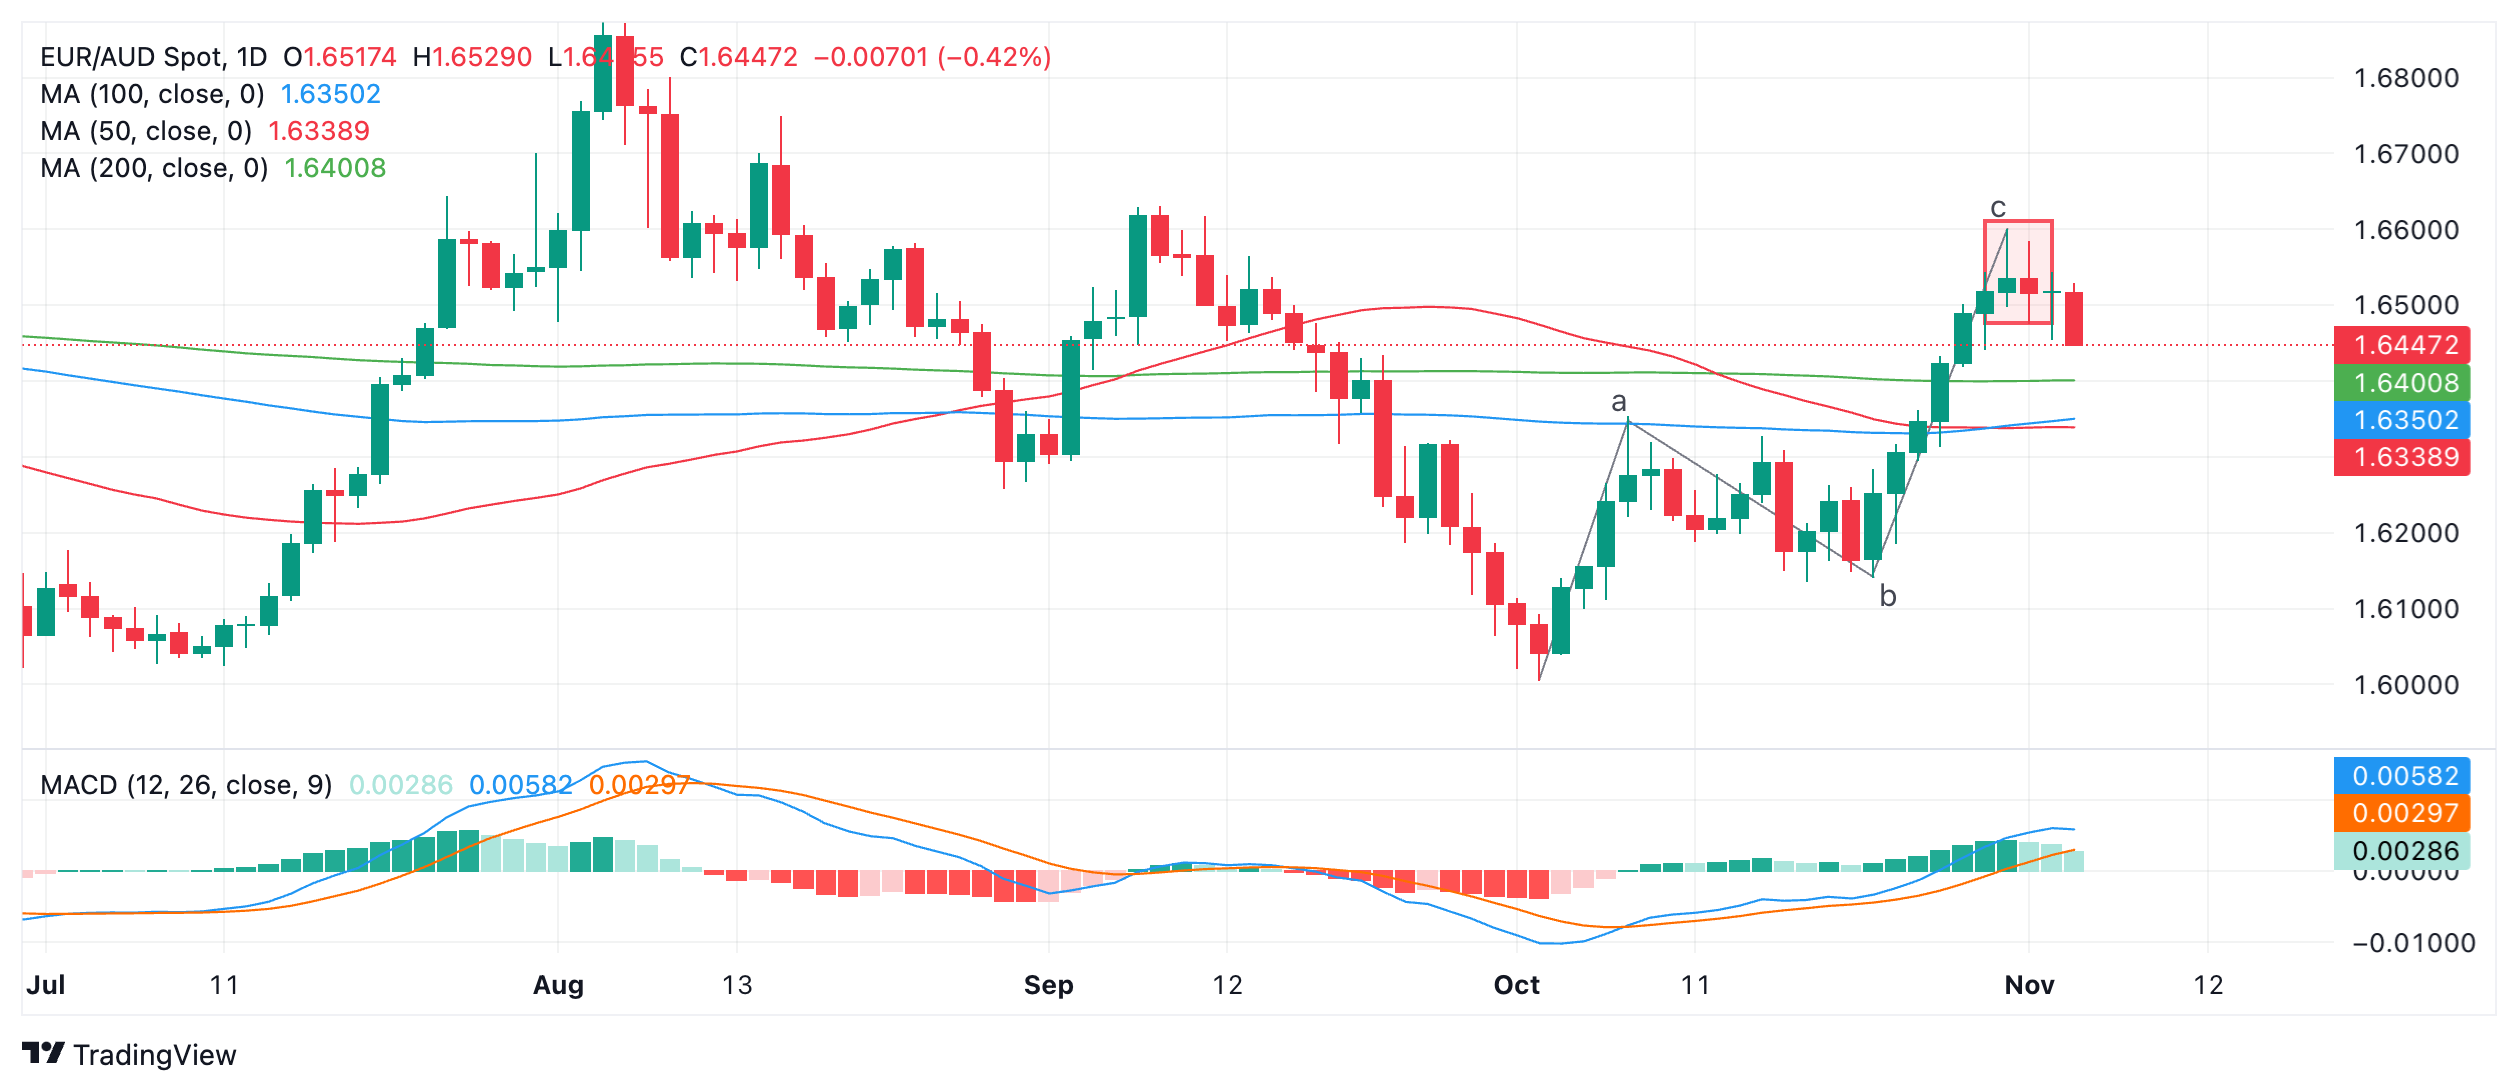
In addition, a bearish down-day followed the day of the Shooting Star and added confirmation. 

Since then, EUR/AUD has continued selling off and there is evidence it is now in a short-term downtrend. Given the principle that “the trend is your friend” the odds favor a continuation lower. 

The next target is at 1.6400 and the 200-day Simple Moving Average (SMA), followed by the cluster of major SMAs underneath at around the 1.6350s. 

The pair may have completed an “abc” three-wave Measured Move pattern at the October 31 highs, further adding to the evidence a down cycle is likely taking over. 

Author

Joaquin Monfort

Joaquin Monfort is a financial writer and analyst with over 10 years experience writing about financial markets and alt data. He holds a degree in Anthropology from London University and a Diploma in Technical analysis.

More from Joaquin Monfort
Share:

Editor's Picks

EUR/USD looks apathetic around 1.1770

EUR/USD comes under renewed pressure on Tuesday, deflating below the 1.1800 support and reversing two consecutive days of gains. The pair’s decline follows the persistent move higher in the US Dollar, as trade uncertainty dominates the sentiment ahead of President Trump’s SOTU speech.

GBP/USD regains 1.3500 and above

GBP/USD extends its advance for the third day in a row on Tuesday, this time retesting the area beyond the 1.3500 hurdle. Cable’s uptick comes despite decent gains in the Greenback and the dovish message from the BoE’s Bailey at the UK Parliament.

Gold appears offered around $5,150

Gold is giving back a good portion of the recent multi-day rally, receding to the $5,150 zone per troy ounce amid the decent bounce in the US Dollar and mixed US Treasuty yields. In the meantime, markets’ attention remain on upcoming comments from Fed speakers.

Ripple’s DeFi shift in focus: Navigating XRPL EVM sidechain growth, XRPFi migration and liquidity

Ripple (XRP) has continued to trade under pressure, extending its decline by approximately 63% from the record high of $3.66 in July. The remittance token is trading above support at $1.35, while its upside appears limited by key supply zones, starting with $1.40, at the time of writing on Tuesday.

The Citrini report: How a debatable AI narrative can shake Wall Street

That AI-related headline alone was enough to rattle investors.US stocks slid sharply on Monday after a widely circulated Citrini Research memo outlined a hypothetical “2028 Global Intelligence Crisis”, warning that rapid AI adoption could push US unemployment into double digits as early as by mid-2028.

XRP pressured by weak ETF flows and declining retail interest

Ripple (XRP) is edging lower, trading above its intraday low of $1.32 at the time of writing on Tuesday. The decline from its weekly opening of $1.39 reflects heightened volatility in the broader cryptocurrency market, accentuated by tariff-triggered uncertainty.