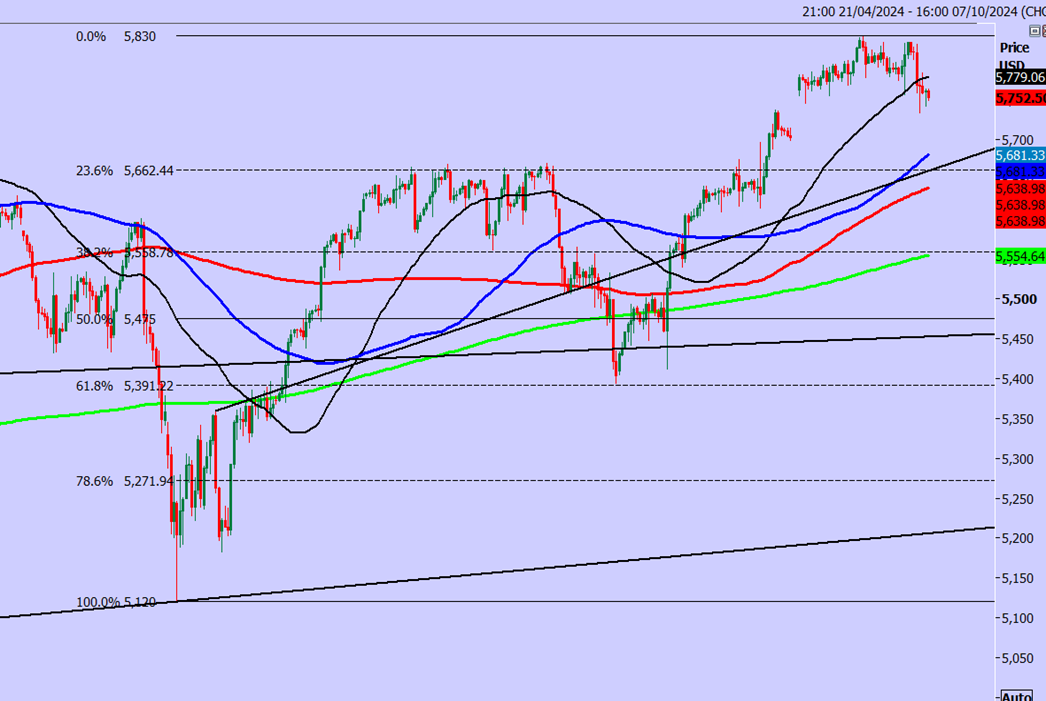
Emini S&P the buying opportunity at 5,745/35 and hit targets of 5,755-5,765

Emini S&P December made a low for the day just 3 points below the buying opportunity at 5745/35 & immediately shot higher to both targets of 5755, 5765.
The low & high for the last session were 5733 - 5822.
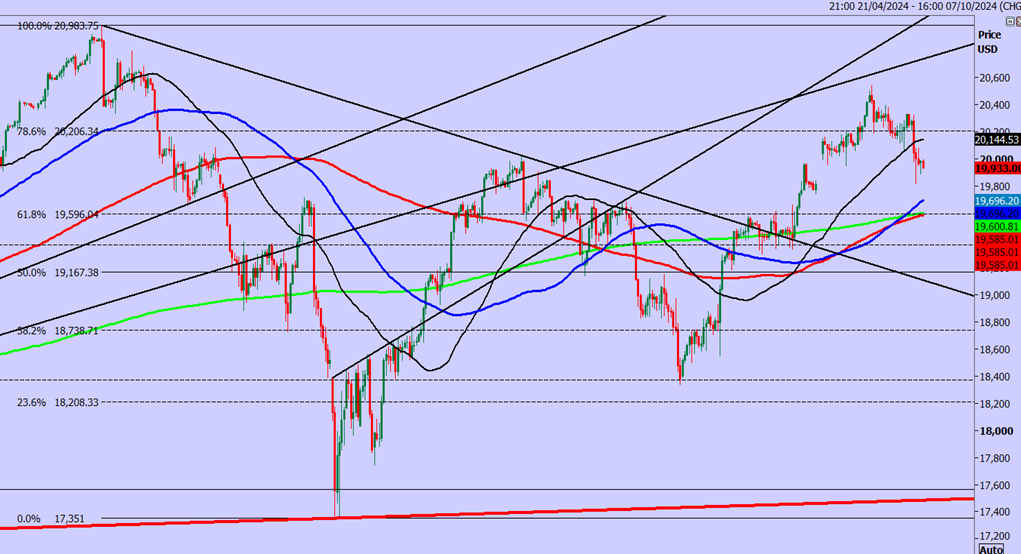
Emini Nasdaq December broke lower but made a low for the day at strong support at 19900/800
Last session high & low for the last session were: 19818 - 20331.
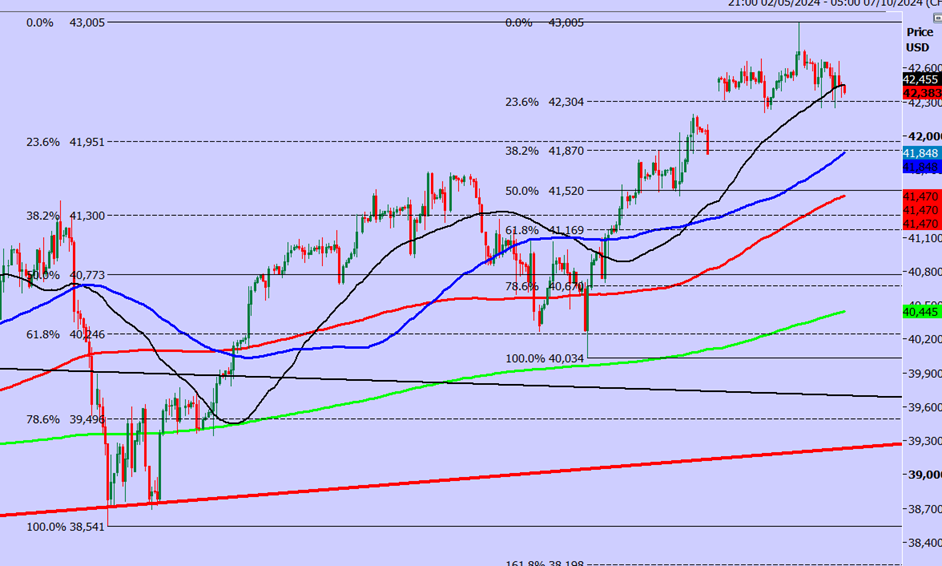
Emini Dow Jones December trades mostly sideways for many days.
Last session high & low for the last session were: 42251 - 42656.
Emini S&P September futures
Emini S&P longs at strong support at 5745/35 worked perfectly as we held above 5730 & shot higher to targets of 5755 & 5765 then as far as 5783.
If we continue higher look for a retest of the all time high of 5820/30.
So we have support again at 5745/35 & longs need stops below 5730.
A break lower this week however could target 5695/90 & even support at 5680/70.
Longs here need stops below 5660.
Nasdaq September futures
We broke support at 20250/150 to hit my next downside target & very strong support at 19900/800 with a low for the day exactly here.
We then shot higher to 20081.
If we continue higher look for 20150/200, perhaps as far as 20250/290.
Strong support again at 19900/800 - Longs need stops below 19700.
A break lower today however risks a slide to 19550, perhaps as far as strong support at 19400/300.
Emini Dow Jones September futures
We wrote: I think gains are likely to be limited in severely overbought conditions but there is definitely no sell signal & I will remain a buyer on any profit taking.
We did dip as far as support at 42350/250 as predicted & this did prove to be an excellent buying opportunity again but longs need stops below 42150 on a retest today.
Targets of 42500 & 42650 were hit immediately, meaning we caught the low & high for the day for the second day in a row.
A break lower this week however risks a slide to 42000/41900 & longs need stops below 41800.
Author

Jason Sen
DayTradeIdeas.co.uk
Jason Sen began his career in the options pits on the trading floor of LIFFE in 1987 at the age of 19, making markets on his own account. In 2001 when the trading floor closed he successfully made the transition to day trading on computer screens.


