|

Elliott Wave view: NVDA bullish momentum looking for more upside [Video]

Short term Elliott Wave View in Nvidia Corporation (ticker: NVDA) suggests that rally from 4.26.2023 low is unfolding as a 5 waves impulse Elliott Wave structure with extension. Up from 4.26.2023 low, wave ((i)) ended at 290.58 and dips in wave ((ii)) ended at 272.40. Stock has resumed higher in wave ((iii)) which subdivides into another 5 waves in lesser degree. Up from wave ((ii)), wave i ended at 276.6 and wave ii ended at 273.80. Wave iii ended at 287.55, pullback in wave iv ended at 283.50, and final leg wave v ended at 292.20 which completed wave (i).

NVDA 60 minutes Elliott Wave chart

NDVA

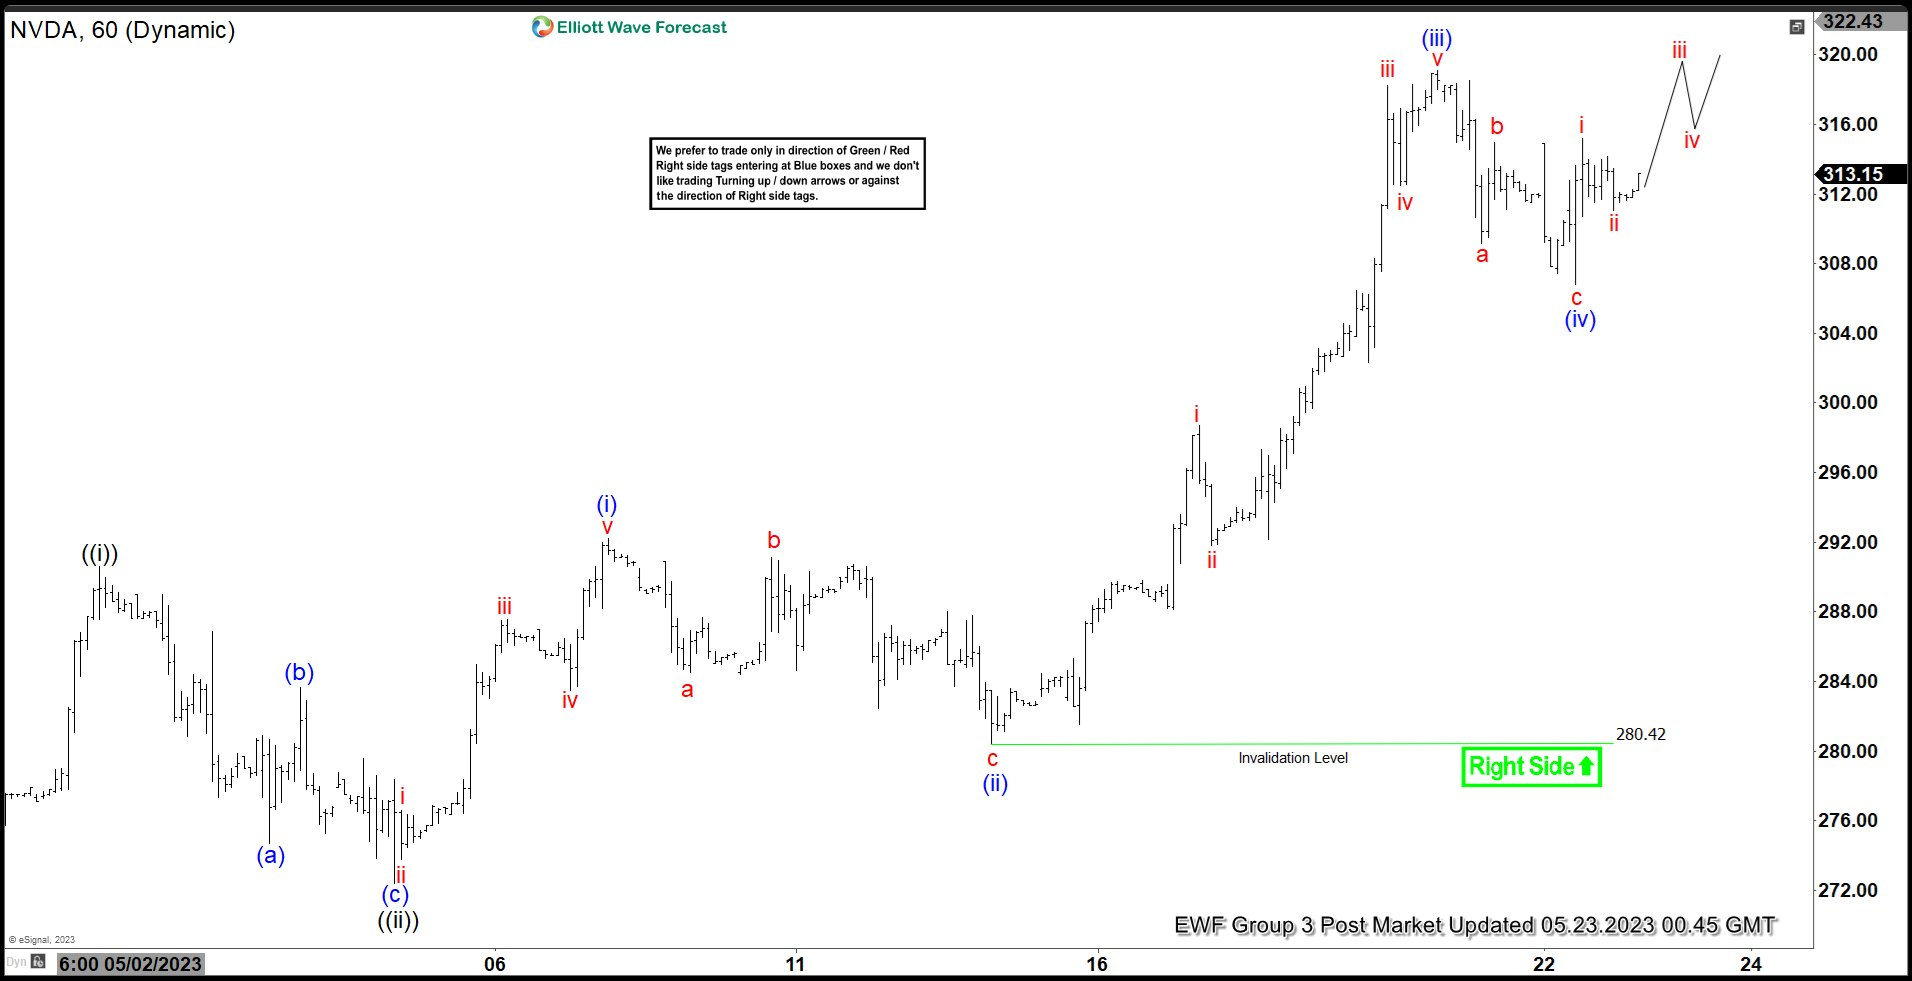
Pullback in wave (ii) ended at 280.42 with internal subdivision as a zigzag structure. Down from wave (i), wave a ended at 284.5, wave b ended at 291.13, and wave c ended at 280.42. This completed wave (ii). The stock has resumed higher in wave (iii). Up from wave (ii), wave i ended at 298.70 and pullback in wave ii ended at 291.84. Wave iii ended at 318.24, pullback in wave iv ended at 312.50, and wave v higher ended at 319.08 which completed wave (iii). Pullback in wave (iv) ended at 306.80 with internal subdivision as a zigzag. Near term, while above 306.80, and more importantly above 280.42, expect stock to extend higher.

NVDA Elliott Wave video

Author

Elliott Wave Forecast Team

Elliott Wave Forecast Team

ElliottWave-Forecast.com

More from Elliott Wave Forecast Team
Share:

Markets move fast. We move first.

Orange Juice Newsletter brings you expert driven insights - not headlines. Every day on your inbox.

By subscribing you agree to our Terms and conditions.

Editor's Picks

EUR/USD bounces toward 1.1750 as US Dollar loses strength

EUR/USD returned to the 1.1750 price zone in the American session on Friday, despite falling Wall Street, which indicates risk aversion. Trading conditions remain thin following the New Year holiday and ahead of the weekend, with the focus shifting to US employment and European data scheduled for next week.

GBP/USD nears 1.3500, holds within familiar levels

After testing 1.3400 on the last day of 2025, GBP/USD managed to stage a rebound. Nevertheless, the pair finds it difficult to gather momentum and trades with modest intraday gains at around 1.3490 as market participants remain in holiday mood.

Gold trims intraday gains, approaches $4,300

Gold retreated sharply from the $4,400  area and trades flat for the day in the $4,320 price zone. Choppy trading conditions exacerbated the intraday decline, although XAU/USD bearish case is out of the picture, considering growing expectations for a dovish Fed and persistent geopolitical tensions.

Cardano gains early New Year momentum, bulls target falling wedge breakout

Cardano kicks off the New Year on a positive note and is extending gains, trading above $0.36 at the time of writing on Friday. Improving on-chain and derivatives data point to growing bullish interest, while the technical outlook keeps an upside breakout in focus.

Economic outlook 2026-2027 in advanced countries: Solidity test

After a year marked by global economic resilience and ending on a note of optimism, 2026 looks promising and could be a year of solid economic performance. In our baseline scenario, we expect most of the supportive factors at work in 2025 to continue to play a role in 2026.

Crypto market outlook for 2026

Year 2025 was volatile, as crypto often is.  Among positive catalysts were favourable regulatory changes in the U.S., rise of Digital Asset Treasuries (DAT), adoption of AI and tokenization of Real-World-Assets (RWA).