Share:

Russell 2000 (RTY) ended a 3 swing corrective rally from 10.13.2022 low at 2016.90 on 2.2.2023 high. From this level, the Index declines lower with internal subdivision as a 5 waves impulse Elliott Wave structure. Down from 2.2.2023 high, wave ((i)) ended at 1906.2 and rally in wave ((ii)) ended at 1970.10. The Index resumes lower in wave ((iii)) towards 1728.5 and wave ((iv)) rally ended at 1800.8. Final leg wave ((v)) ended at 1708 which completed wave 1 in higher degree. Rally in wave 2 is now in progress to correct cycle from 2.3.2023 high in 3, 7, or 11 swing before the decline resumes.

$RTY 60 minutes Elliott Wave chart

RTY

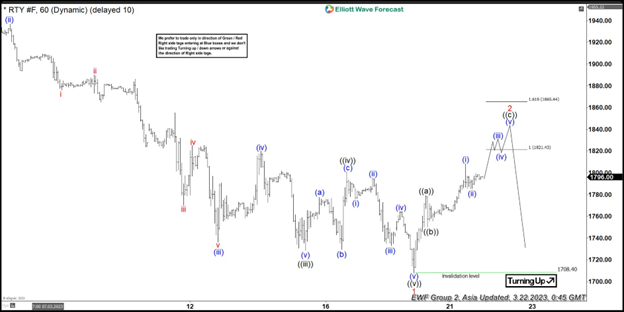
Internal subdivision of wave 2 is unfolding as a zigzag Elliott Wave structure. Up from wave 1, wave ((a)) ended at 1779.4 and pullback in wave ((b)) ended at 1750.40. Wave ((c)) higher is in progress as 5 waves. Up from wave ((b)), wave (i) ended at 1808.2 and wave (ii) pullback ended at 1785.30. Expect the Index to extend higher before it completes wave ((c)) of 2. Potential target higher is 100% – 161.8% fibonacci extension of wave ((a)). This area comes at 1821.4 – 1865.4 where the rally in Russell may fail and the Index starts to resume lower. As far as pivot at 2.2.2023 high at 2016.9 stays intact, expect rally to fail in 3, 7, or 11 swing for more downside.

$RTY Elliott Wave video

Share: Feed news

FURTHER DISCLOSURES AND DISCLAIMER CONCERNING RISK, RESPONSIBILITY AND LIABILITY Trading in the Foreign Exchange market is a challenging opportunity where above average returns are available for educated and experienced investors who are willing to take above average risk. However, before deciding to participate in Foreign Exchange (FX) trading, you should carefully consider your investment objectives, level of xperience and risk appetite. Do not invest or trade capital you cannot afford to lose. EME PROCESSING AND CONSULTING, LLC, THEIR REPRESENTATIVES, AND ANYONE WORKING FOR OR WITHIN WWW.ELLIOTTWAVE- FORECAST.COM is not responsible for any loss from any form of distributed advice, signal, analysis, or content. Again, we fully DISCLOSE to the Subscriber base that the Service as a whole, the individual Parties, Representatives, or owners shall not be liable to any and all Subscribers for any losses or damages as a result of any action taken by the Subscriber from any trade idea or signal posted on the website(s) distributed through any form of social-media, email, the website, and/or any other electronic, written, verbal, or future form of communication . All analysis, trading signals, trading recommendations, all charts, communicated interpretations of the wave counts, and all content from any media form produced by www.Elliottwave-forecast.com and/or the Representatives are solely the opinions and best efforts of the respective author(s). In general Forex instruments are highly leveraged, and traders can lose some or all of their initial margin funds. All content provided by www.Elliottwave-forecast.com is expressed in good faith and is intended to help Subscribers succeed in the marketplace, but it is never guaranteed. There is no “holy grail” to trading or forecasting the market and we are wrong sometimes like everyone else. Please understand and accept the risk involved when making any trading and/or investment decision. UNDERSTAND that all the content we provide is protected through copyright of EME PROCESSING AND CONSULTING, LLC. It is illegal to disseminate in any form of communication any part or all of our proprietary information without specific authorization. UNDERSTAND that you also agree to not allow persons that are not PAID SUBSCRIBERS to view any of the content not released publicly. IF YOU ARE FOUND TO BE IN VIOLATION OF THESE RESTRICTIONS you or your firm (as the Subscriber) will be charged fully with no discount for one year subscription to our Premium Plus Plan at $1,799.88 for EACH person or firm who received any of our content illegally through the respected intermediary’s (Subscriber in violation of terms) channel(s) of communication.

Follow us on Telegram

Stay updated of all the news

Join Telegram

Recommended content


Follow us on Telegram

Stay updated of all the news

Join Telegram

Recommended content

Editors’ Picks

EUR/USD rebounds from multi-week lows, trades above 1.0750

EUR/USD rebounds from multi-week lows, trades above 1.0750

EUR/USD came under heavy bearish pressure and declined to its weakest level in three weeks below 1.0750 on Friday after the stronger-than-expected Nonfarm Payrolls data. Week-end flows, however, helped the pair erase its daily losses.

EUR/USD News

GBP/USD remains on track to snap three-week winning streak

GBP/USD remains on track to snap three-week winning streak

GBP/USD recovered toward 1.2550 after coming in within a touching distance of 1.2500 in the second half of the day after Nonfarm Payrolls came in at 199,000 for November. Despite the recent rebound, the pair remains on track to snap a three-week winning streak.

GBP/USD News

Gold retreats below $2,020 as US yields push higher

Gold retreats below $2,020 as US yields push higher

Gold broke below its daily range and declined toward $2,010 with the immediate reaction to the upbeat US November jobs report. Although XAU/USD managed to recover toward $2,020, rising US Treasury bond yields triggered another leg lower.

Gold News

Bitcoin price could retrace to $42,000 if US Nonfarm Payroll comes in at 180,000

Bitcoin price could retrace to $42,000 if US Nonfarm Payroll comes in at 180,000

Bitcoin price just like other assets, is highly impacted by the macro-financial developments. This includes the Nonfarm Payrolls (NFP) report released by the BLS of the United States. 

Read more

The week ahead – Fed, ECB and Bank of England rate decisions

The week ahead – Fed, ECB and Bank of England rate decisions

When the Federal Reserve kept rates unchanged back in November for the second meeting in a row there was still the distinct possibility that the final meeting of 2023 would provide the possibility of one more rate rise to round off the year in line with Fed policymakers dot plot forecasts of 5.6%.

Read more

Forex MAJORS

Cryptocurrencies

Signatures