|

Elliott Wave perspective: Nvidia wave three close to conclusion [Video]

Since July 4, 2025, Nvidia (NVDA) has been experiencing a robust rally. The rally is unfolding as a five-wave impulse structure according to Elliott Wave analysis. This upward movement began at a low on July 4, 2025, with wave (1) concluding at $115.44. A subsequent pullback in wave (2) found support at $95.04. This sets the stage for the ongoing wave (3), which has developed as another impulsive subdivision.

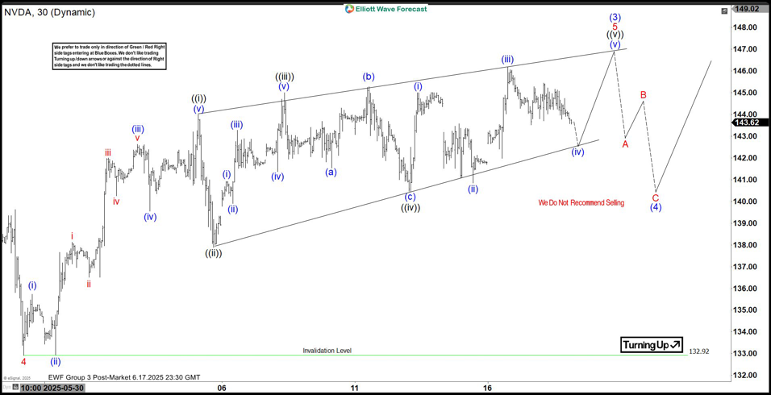
Within wave (3), the stock advanced in wave 1 to $111.92. A brief dip in wave 2 then followed to $104.08. The momentum resumed in wave 3, pushing the stock to $143.84. Afterwards, a corrective wave 4 settled at $132.92, as observed on the 30-minute chart below. Currently, Nvidia is advancing in wave 5 of (3). This wave has seen wave ((i)) peak at $144, followed by a pullback in wave ((ii)) to $137.88. The stock then surged in wave ((iii)) to $145, with a minor correction in wave ((iv)) completing at $140.46.

Wave ((v)) higher should end soon, concluding wave 5 of (3). Following this, a larger-degree wave (4) correction is expected, potentially unfolding in a 3, 7, or 11-swing pattern. This pullback should precede a final ascent in wave (5), completing the cycle from the July 4, 2025 low.

Nvidia 30-minute Elliott Wave technical chart

NVDA Elliott Wave [Video]

Author

Elliott Wave Forecast Team

Elliott Wave Forecast Team

ElliottWave-Forecast.com

More from Elliott Wave Forecast Team
Share:

Editor's Picks

EUR/USD tests nine-day EMA support near 1.1850

EUR/USD remains in the negative territory for the fourth successive session, trading around 1.1870 during the Asian hours on Friday. The 14-day Relative Strength Index momentum indicator at 56 stays above the midline, confirming steady momentum. RSI has eased but remains above 50, indicating momentum remains constructive for the bulls.

GBP/USD consolidates around 1.3600 vs. USD; looks to US CPI for fresh impetus

The GBP/USD pair remains on the defensive through the Asian session on Friday, though it lacks bearish conviction and holds above the 1.3600 mark as traders await the release of the US consumer inflation figures before placing directional bets.

Gold recovers swiftly from weekly low, climbs back closer to $5,000 ahead of US CPI

Gold regains positive traction during the Asian session on Friday and recovers a part of the previous day's heavy losses to the $4,878-4,877 region, or the weekly low. The commodity has now moved back closer to the $5,000 psychological mark as traders keenly await the release of the US consumer inflation figures for more cues about the Federal Reserve's policy path.

Solana: Mixed market sentiment caps recovery

Solana is trading at $79 as of Friday, following a correction of over 9% so far this week. On-chain and derivatives data indicates mixed sentiment among traders, further limiting the chances of a price recovery.

A tale of two labour markets: Headline strength masks underlying weakness

Undoubtedly, yesterday’s delayed US January jobs report delivered a strong headline – one that surpassed most estimates. However, optimism quickly faded amid sobering benchmark revisions.

Solana Price Forecast: Mixed market sentiment caps recovery

Solana (SOL) is trading at $79 as of Friday, following a correction of over 9% so far this week. On-chain and derivatives data indicates mixed sentiment among traders, further limiting the chances of a price recovery.