Elliott Wave outlook suggests more gains ahead for Pan American Silver (PAAS)

Pan American Silver Corp. (NYSE: PAAS, TSX: PAAS) is one of the world’s leading silver producers, operating mines and exploration projects across the Americas. The company also produces gold and other base metals, positioning itself as a diversified precious metals miner with a strong long-term growth profile. In this article, we will look at the long term Elliottwave path of the stock.
PAAS monthly Elliott Wave chart
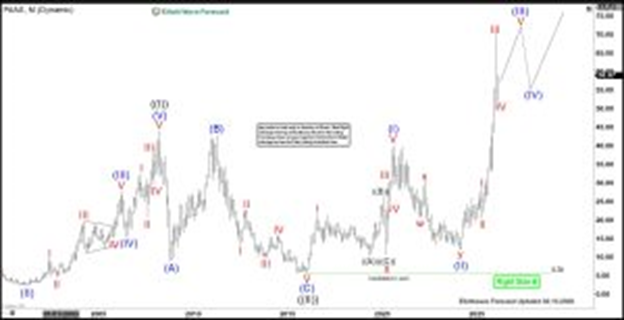
Pan American Silver completed wave ((II)) of the Grand Supercycle at the $5.70 low, establishing a major long-term pivot. From that foundation, the stock has embarked on wave ((III)), unfolding as a bullish impulse. Wave (I) advanced to $40.11 before a corrective wave (II) retraced to $12.16. The rally then resumed in wave (III), within which wave I peaked at $28.60 and wave II pulled back to $20.55. Wave III of higher degree extended to $69.99, followed by a wave IV correction that ended at $52.16. As long as the $5.70 low remains intact, corrective pullbacks are expected to attract buyers within the 3-, 7-, or 11-swing sequence, reinforcing the case for further upside in the long-term structure
PAAS daily Elliott Wave chart
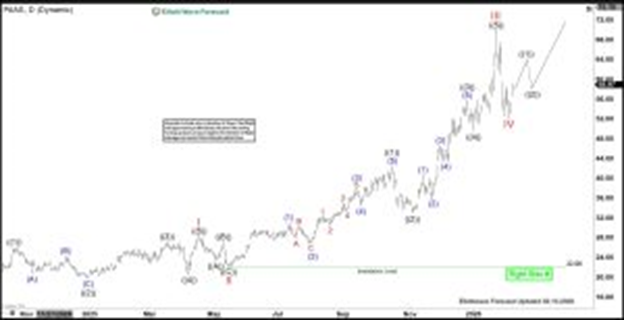
Pan American Silver (PAAS) began its rally from the February 28, 2024 low at $22.08, completing wave I at $28.60 before undergoing a corrective wave II that returned to the same $22.08 pivot. From that foundation, the stock launched into wave III, which has unfolded as a well-defined impulsive structure. Wave ((1)) carried prices to $42.57, followed by a wave ((2)) correction down to $33.08. The next advance lifted the stock to $55.85, marking the completion of wave ((3)), before a pullback in wave ((4)) ended at $49.61. The final leg of the sequence, wave ((5)), extended to $69.99, completing wave III of higher degree. A subsequent wave IV correction then found support at $52.16. Looking ahead, as long as the $22.08 pivot remains intact, pullbacks are expected to hold within the 3, 7, or 11 swing sequence, providing a supportive structure for further upside potential.
Author

Elliott Wave Forecast Team
ElliottWave-Forecast.com


