Elliott Wave analysis: SPX targets recovery in three waves at least [Video]
![Elliott Wave analysis: SPX targets recovery in three waves at least [Video]](https://editorial.fxsstatic.com/images/i/SP500-bearish-withoutbear.jpg)
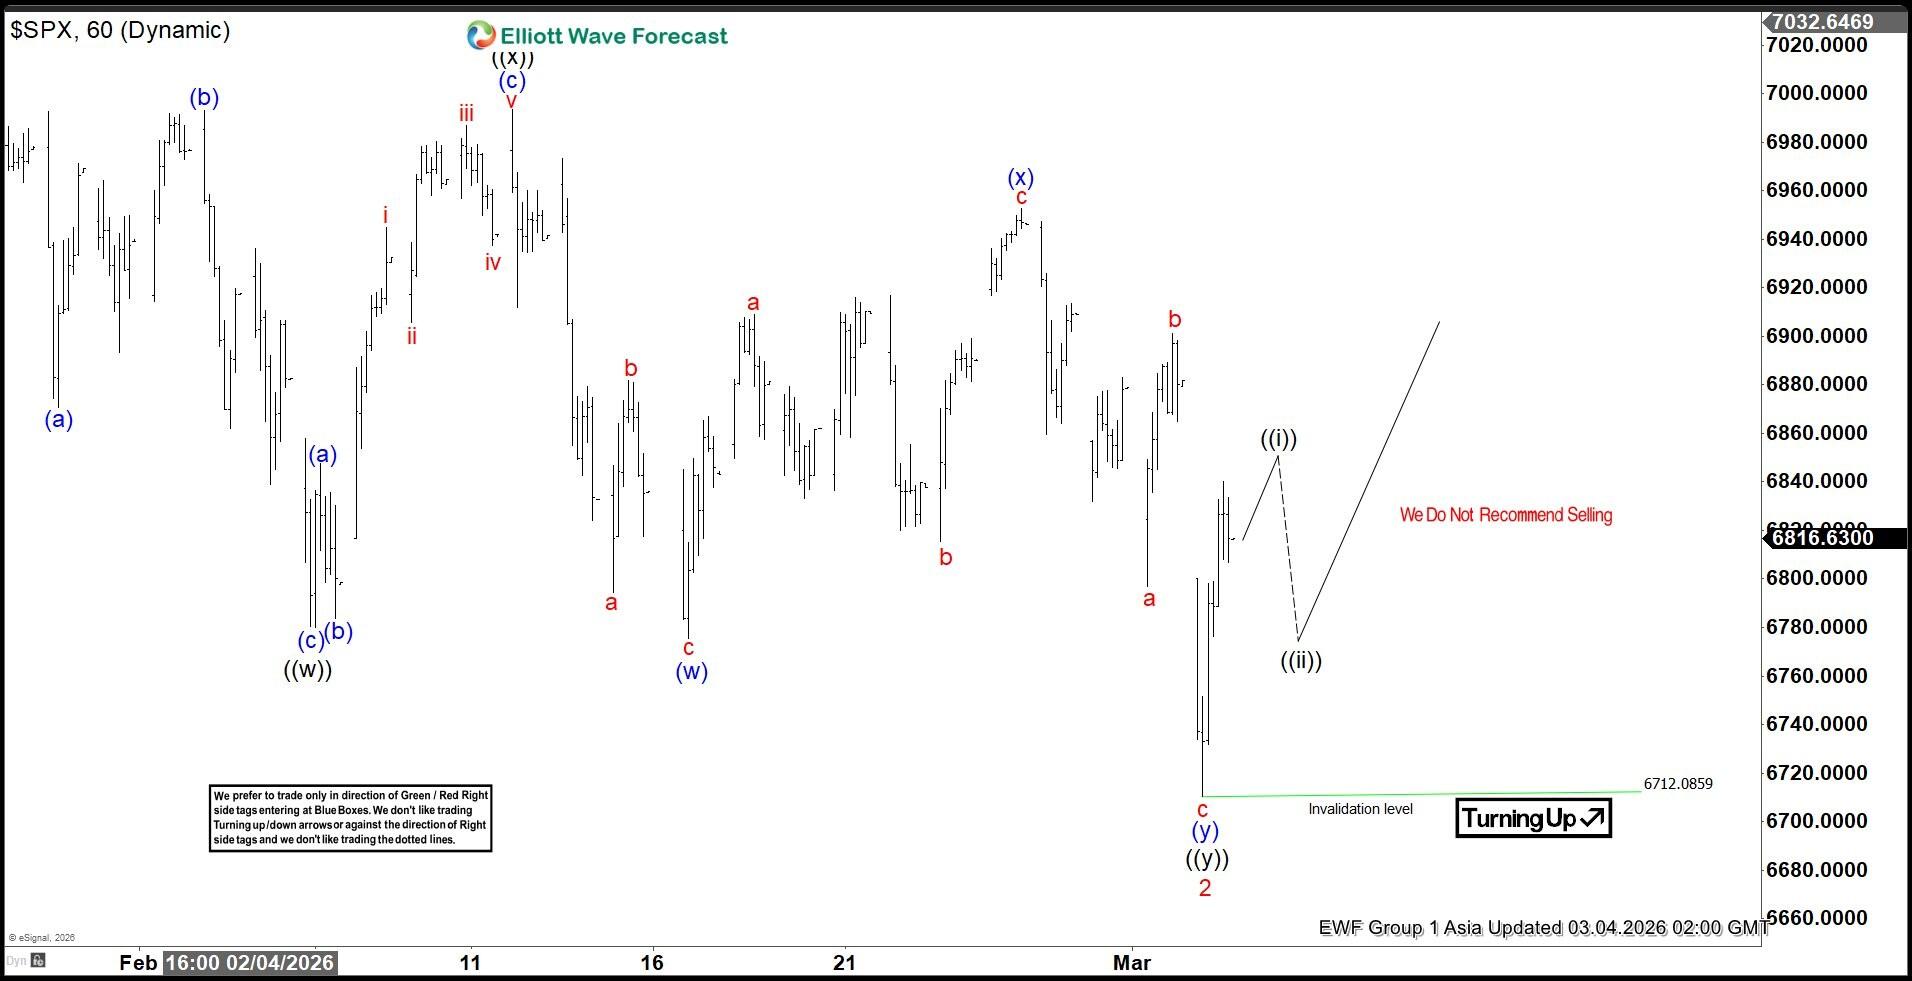
Short-term Elliott Wave analysis indicates that the rally to 7002.28 on January 28, 2026 marked the completion of wave 1. Following this advance, the market entered a corrective phase. The wave 2 pullback recently concluded at 6712, as illustrated in the one-hour chart. This decline corrected the cycle that began from the November 21, 2025 low, and its internal subdivisions unfolded in a double three structure, a common corrective pattern within Elliott Wave theory.
From the peak of wave 1, the first leg lower, wave ((w)), ended at 6780.13. A subsequent rally formed wave ((x)), which terminated at 6993.48. The final leg, wave ((y)), pushed lower and ended at 6712.08. This level aligns with the 100%–161.8% Fibonacci extension of wave ((w)), measured at 6629–6768, reinforcing its significance as a support zone.
With the correction complete, the Index has turned higher in wave 3. However, a decisive break above 7002.28 is required to fully confirm that the larger degree correction has ended. Until that level is exceeded, the possibility of a broader corrective structure remains. While the Index retains potential to extend toward new all-time highs, traders should remain cautious. The larger cycle from the April 2025 low is mature and could terminate at any time.
Therefore, strict risk management is essential when pursuing upside opportunities. In the near term, as long as the pivot at 6712.08 holds, expectations favor continued strength and further extension higher.
S&P 500 (SPX) 60-minute Elliott Wave chart
SPX Elliott Wave [Video]
Author

Elliott Wave Forecast Team
ElliottWave-Forecast.com


