|

Elliott Wave analysis: Lululemon Athletica (NASDAQ: LULU) on different timeframes

The Elliott Wave analysis for Lululemon Athletica (NASDAQ: LULU) provides a detailed examination of its ongoing corrective structure within a larger five-wave impulsive sequence.

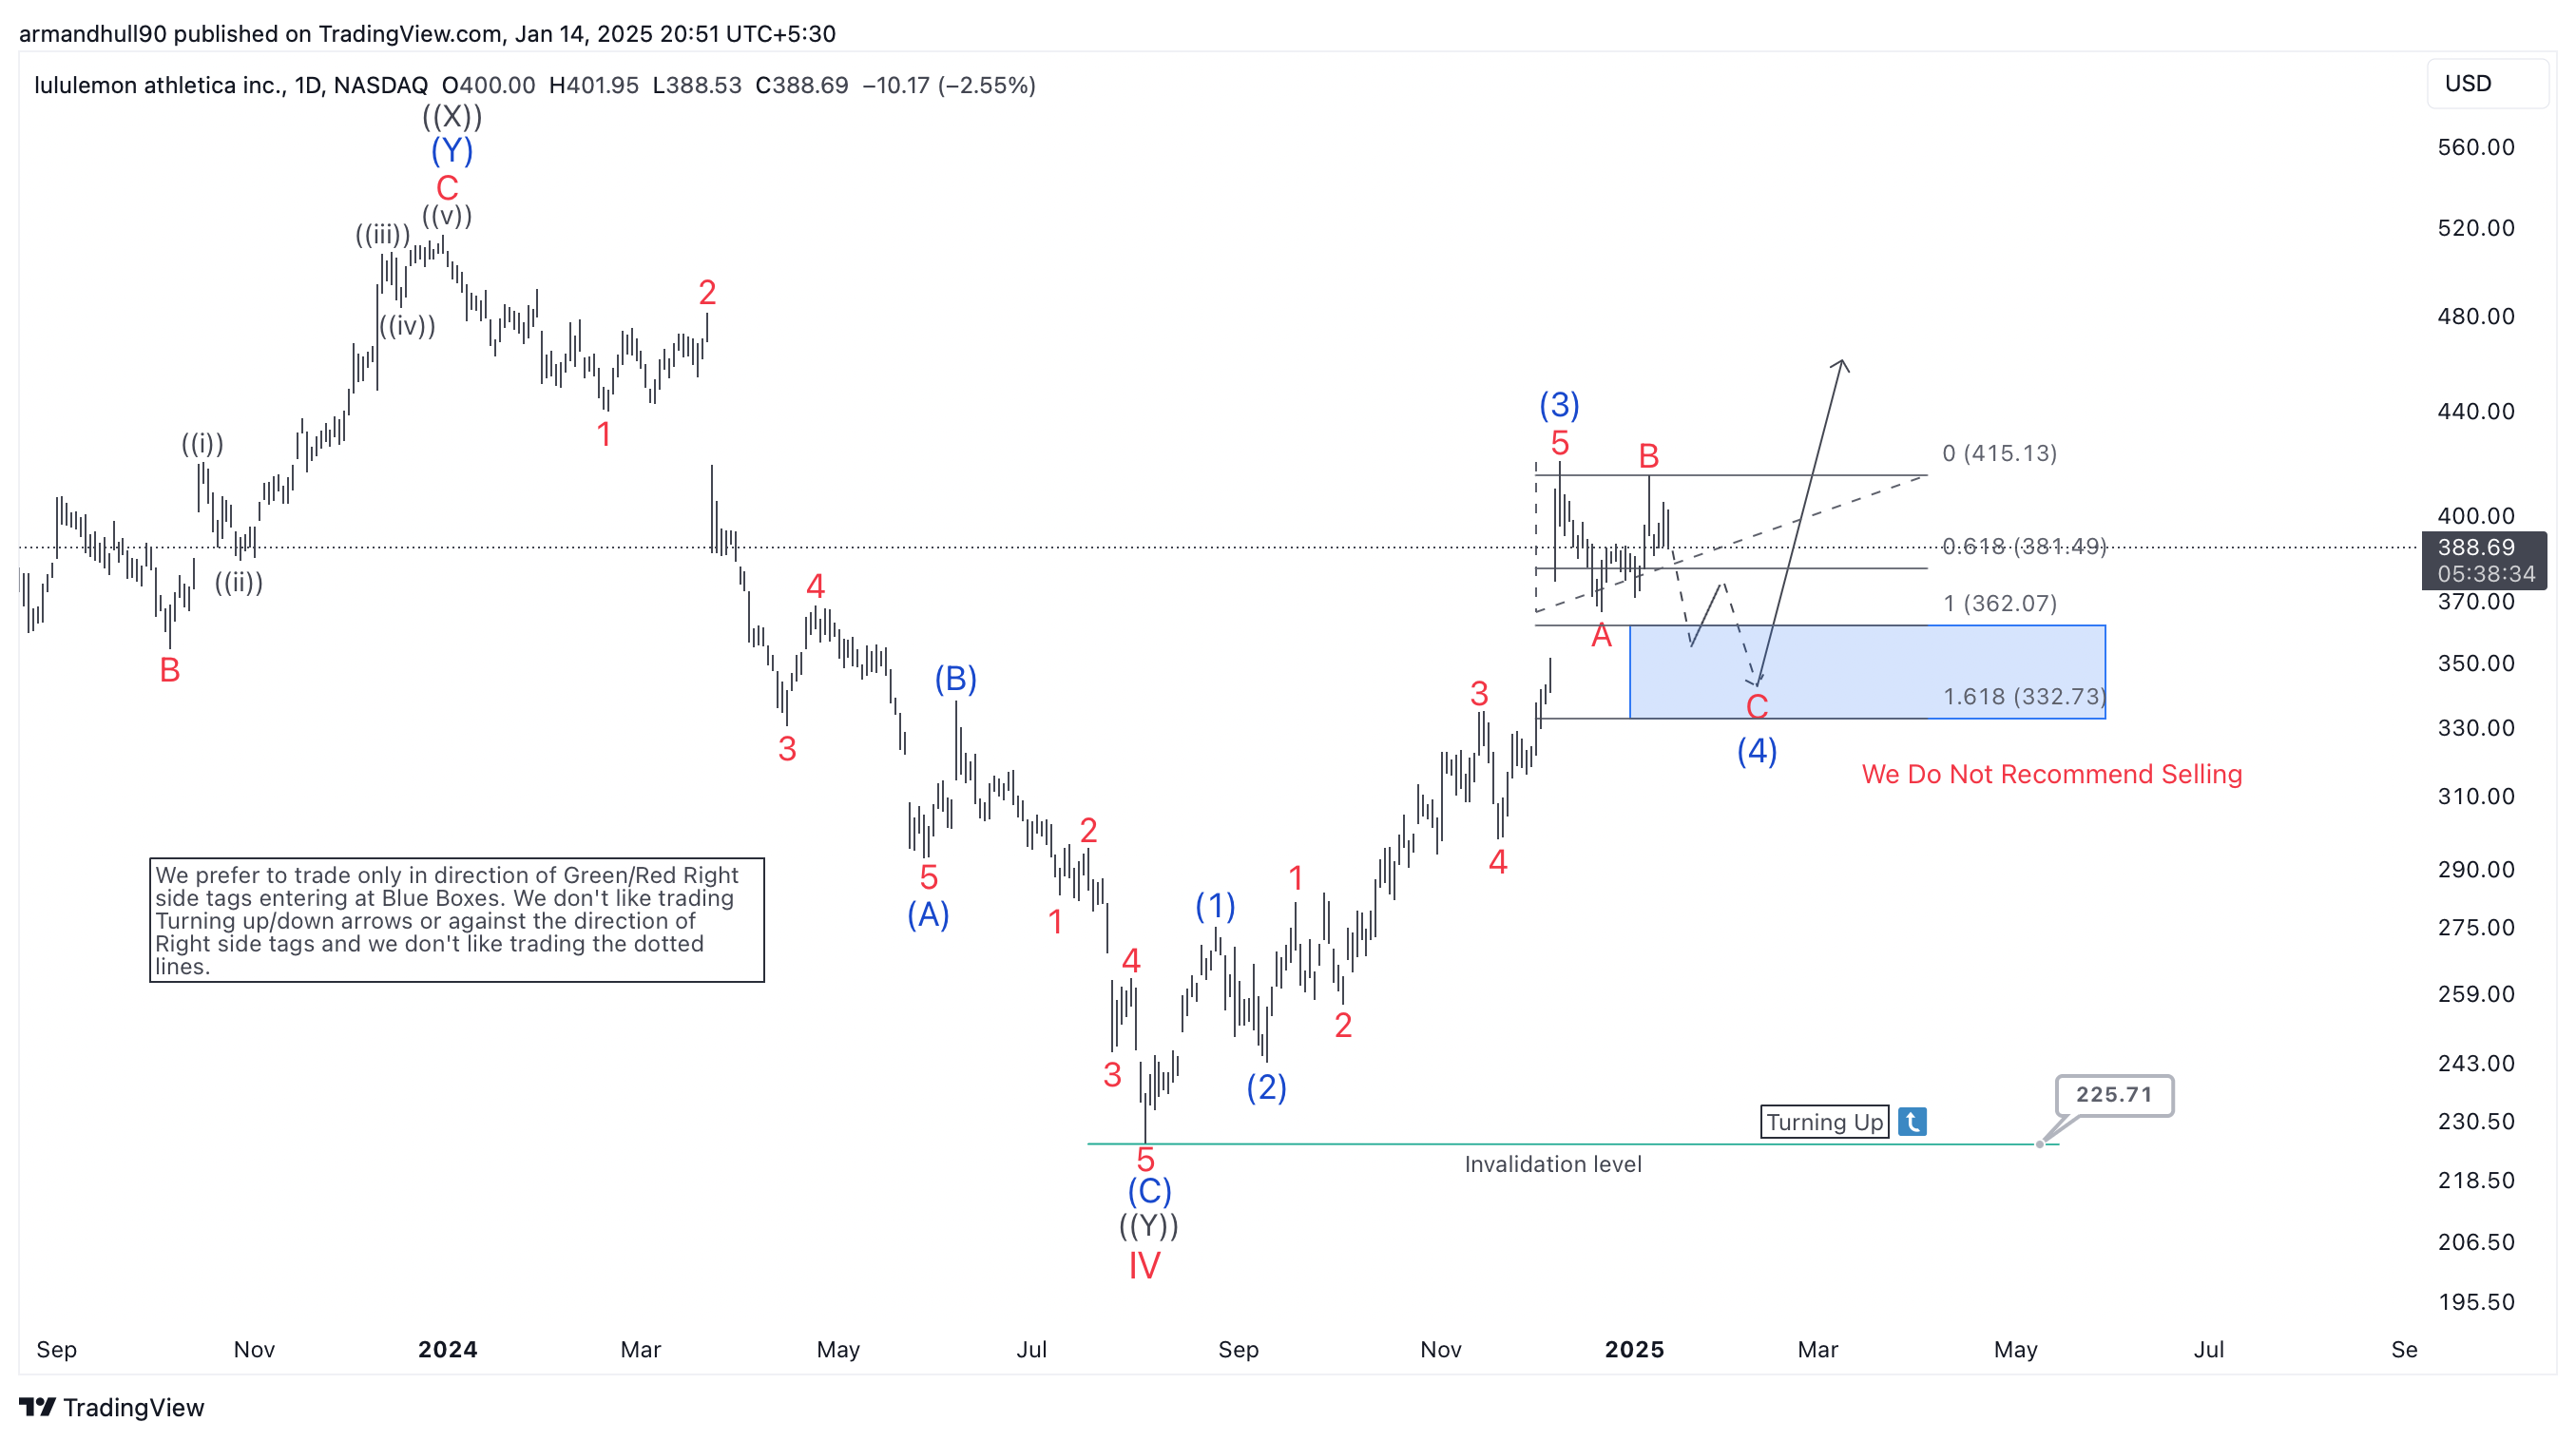
Daily Elliott Wave counts

On the daily chart, the stock remains in wave (4), a corrective phase within a larger impulsive trend. Wave (4) appears to follow an ABC zigzag pattern. Wave A has already ended as a five-wave decline. Meanwhile, wave B is still developing. It might take the form of a flat or expanded flat correction with three distinct waves.

Once wave B completes, wave C is likely to move downward. It could reach the Fibonacci extension zone between 1.0 ($361.72) and 1.618 ($332.38). This area corresponds with the “blue box,” a key high-probability reversal zone. The blue box signals where wave (4) might end, offering a potential entry for the bullish wave (5). The invalidation level is positioned below $225.71, ensuring a clear boundary for risk management.

Chart

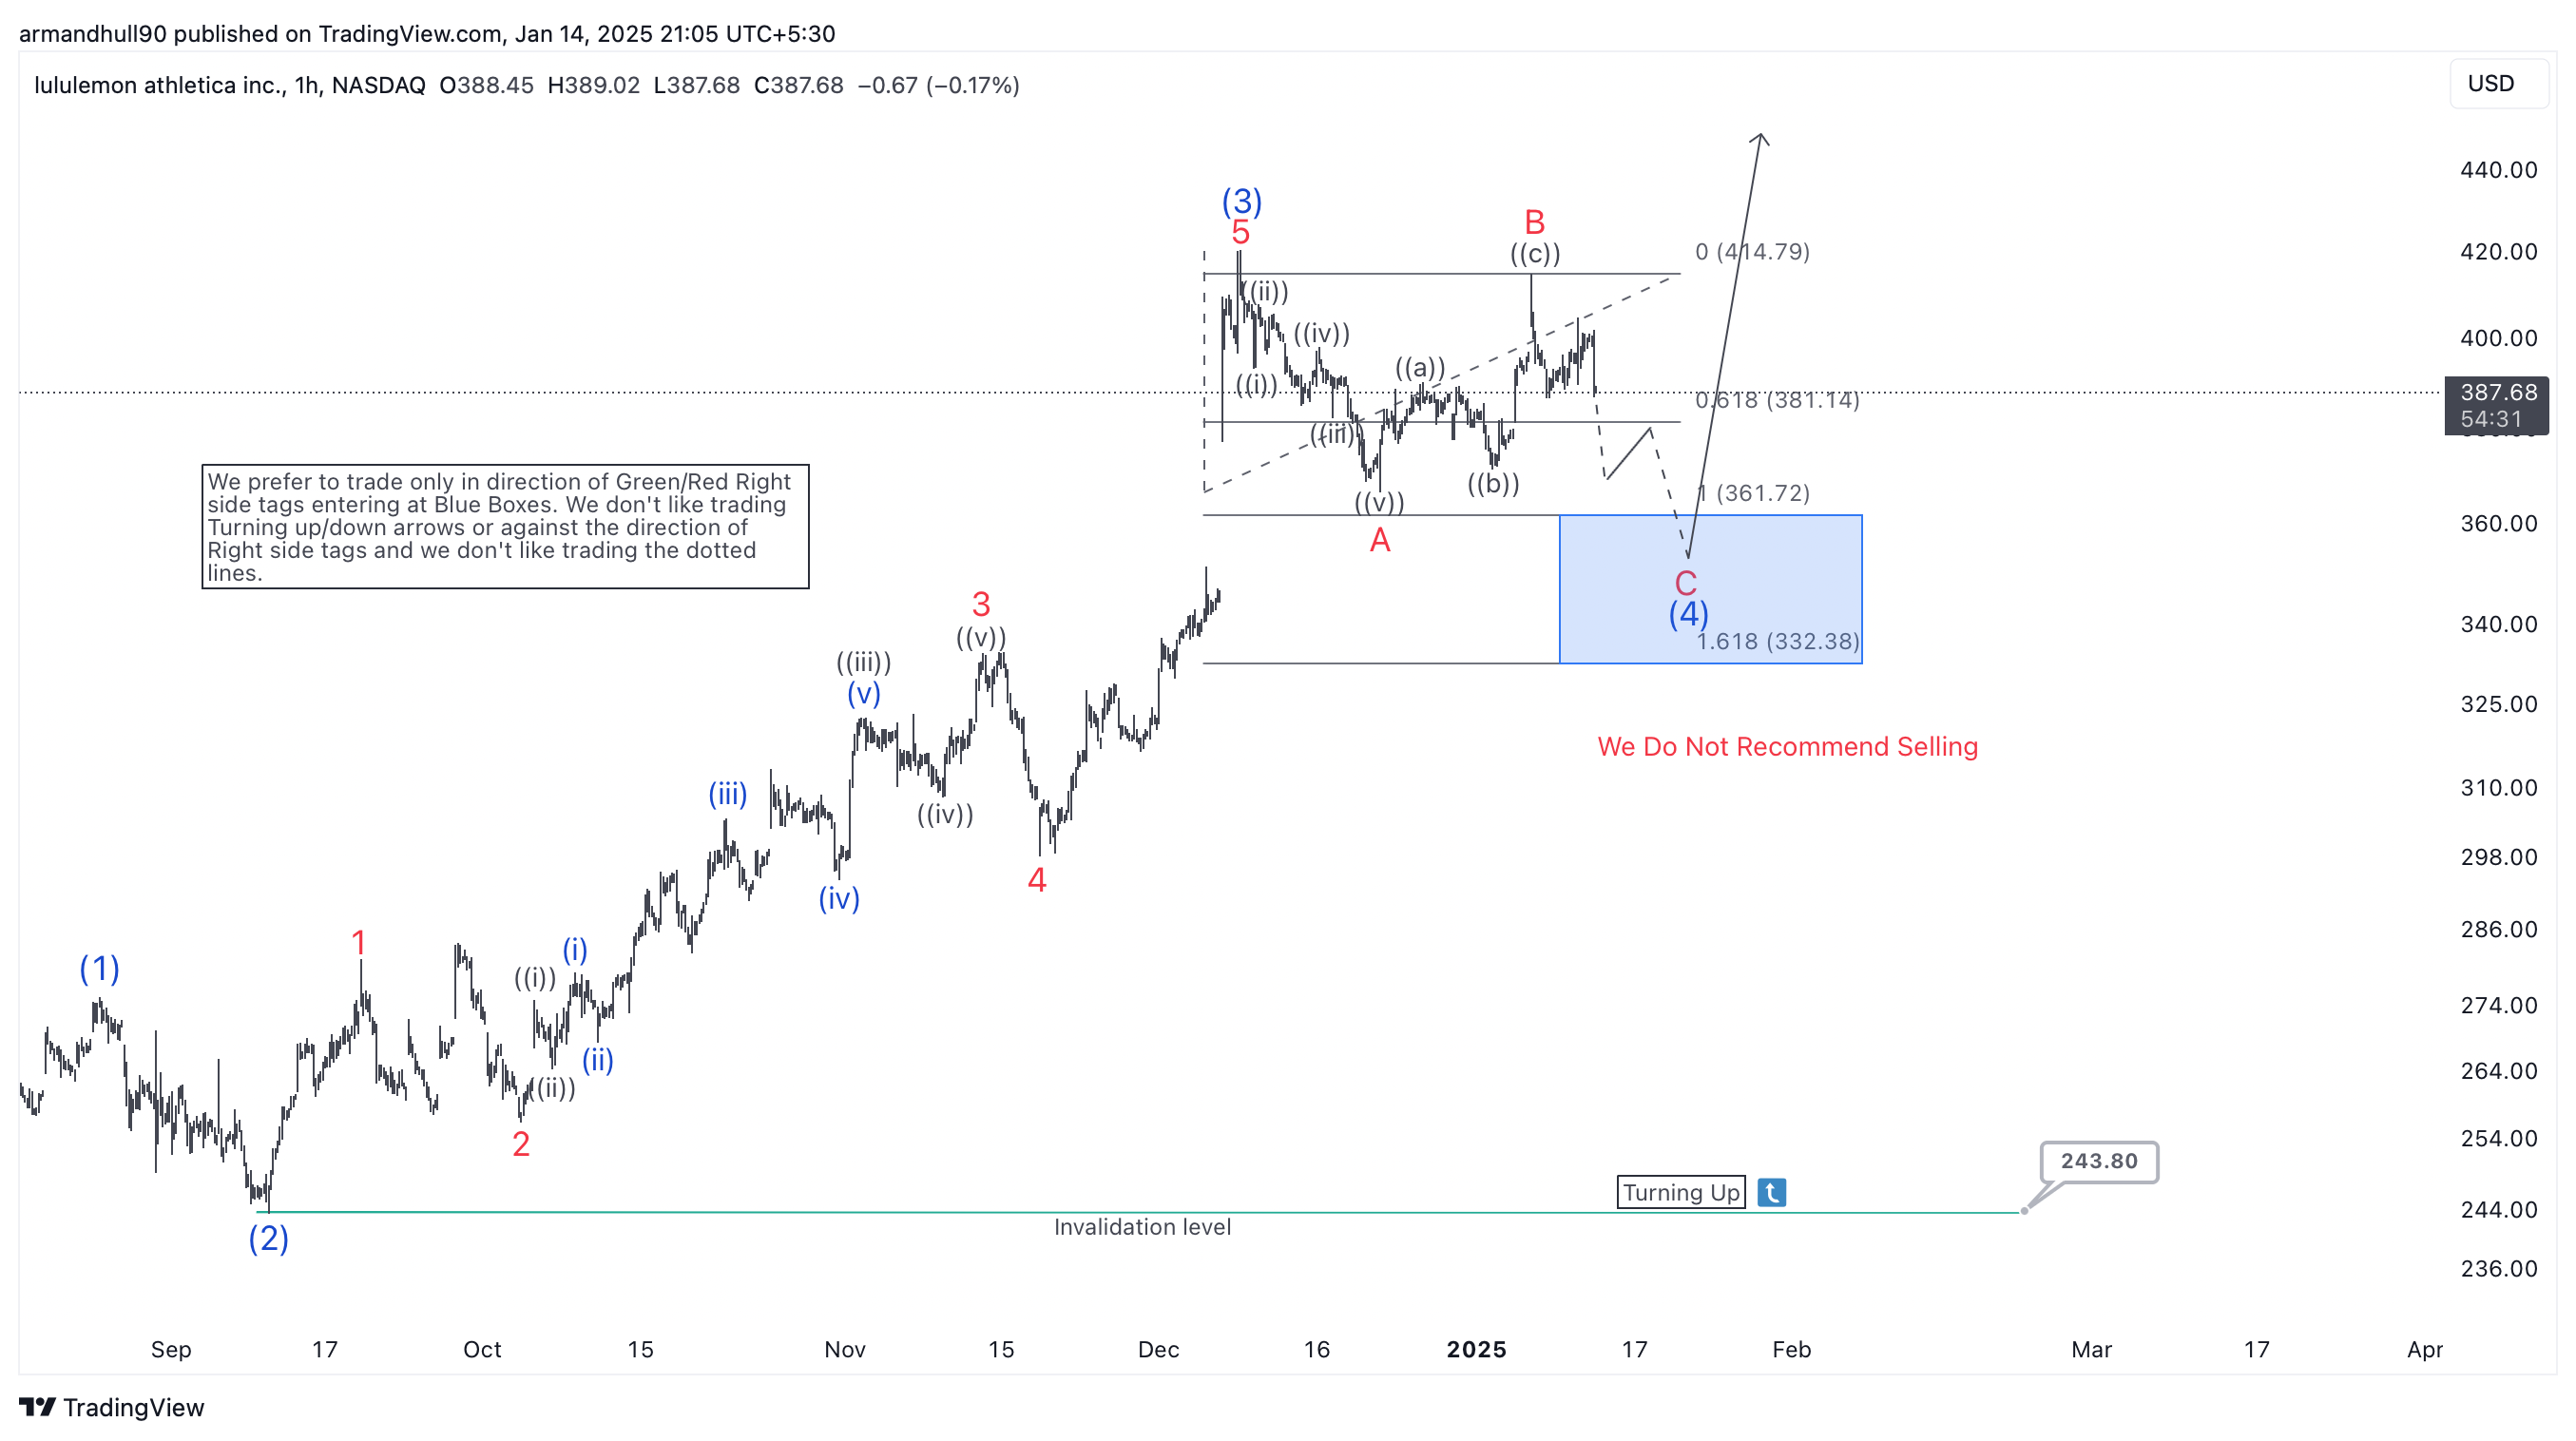
Hourly counts: Short-term outlook

On the hourly chart, wave (4) reveals crucial details, especially the structure of wave B. This wave is developing as a complex correction, likely a flat or double zigzag. Wave A already ended with a clear five-wave decline. Meanwhile, wave B is unfolding in a three-wave corrective pattern.Next, wave C is expected to complete as a five-wave decline. It will likely reach the blue box between $361.72 and $332.38. This area acts as a strong support zone and provides a high-probability reversal point. If the price reverses here, wave (5) could begin. This upward move may surpass the wave (3) high of $415.13, offering significant bullish potential.

Moreover, the analysis highlights the importance of trading in the direction of green right-side tags. These tags indicate favorable trends. Traders should avoid speculative positions, such as shorting in the blue box or relying on dotted-line projections. When wave (5) materialises as expected, it will likely confirm the Elliott Wave analysis and unlock further upside potential.

Chart

Author

Elliott Wave Forecast Team

Elliott Wave Forecast Team

ElliottWave-Forecast.com

More from Elliott Wave Forecast Team
Share:

Markets move fast. We move first.

Orange Juice Newsletter brings you expert driven insights - not headlines. Every day on your inbox.

By subscribing you agree to our Terms and conditions.

Editor's Picks

EUR/USD steadies near 1.1750 ahead of final Eurozone CPI amid fading USD recovery

The EUR/USD pair steadies around the 1.1750 area during the Asian session on Wednesday, and for now, seems to have stalled the previous day's sharp retracement slide from the highest level since September 24. Meanwhile, the fundamental backdrop remains tilted in favor of bullish traders and suggests that the path of least resistance for spot prices remains to the upside.

GBP/USD gains ground above 1.3400 on UK PMI optimism

The GBP/USD pair gains momentum to around 1.3425 during the early Asian session on Wednesday. The Pound Sterling edges higher against the Greenback on the upbeat UK preliminary S&P Global Purchasing Managers' Index data. Traders will take more cues from the Fedspeak later on Wednesday. 

Gold advances to near seven-week highs amid US labor market cooling

Gold price extends its upside to near seven-week highs above $4,300 during the Asian trading hours on Wednesday. The precious metal gains momentum as the US labor market remains relatively resilient but shows signs of slowing. The mixed US employment report for November reinforces bets of further rate cuts by the US Federal Reserve and weighs on the US Dollar.

Top Crypto Gainers: SPX6900, Pi Network, Filecoin – Sudden rebound lifts bullish spirit

SPX6900, Pi Network, and Filecoin emerge as top gainers in the last 24 hours as the broader cryptocurrency market remains under bearish pressure. The sudden rebound in SPX, PI, and FIL suggests a possible rally, as the Moving Average Convergence Divergence indicator on the 4-hour chart flashes a buy signal. 

Ukraine-Russia in the spotlight once again

Since the start of the week, gold’s price has moved lower, but has yet to erase the gains made last week. In today’s report we intend to focus on the newest round of peace talks between Russia and Ukraine, whilst noting the release of the US Employment data later on day and end our report with an update in regards to the tensions brewing in Venezuela.

BNB Price Forecast: BNB slips below $855 as bearish on-chain signals and momentum indicators turn negative

BNB, formerly known as Binance Coin, continues to trade down around $855 at the time of writing on Tuesday, after a slight decline the previous day. Bearish sentiment further strengthens as BNB’s on-chain and derivatives data show rising retail activity.