Dr Reddy Laboratories Elliott Wave technical analysis [Video]
![Dr Reddy Laboratories Elliott Wave technical analysis [Video]](https://editorial.fxsstatic.com/images/i/Health-Stocks_1_XtraLarge.png)
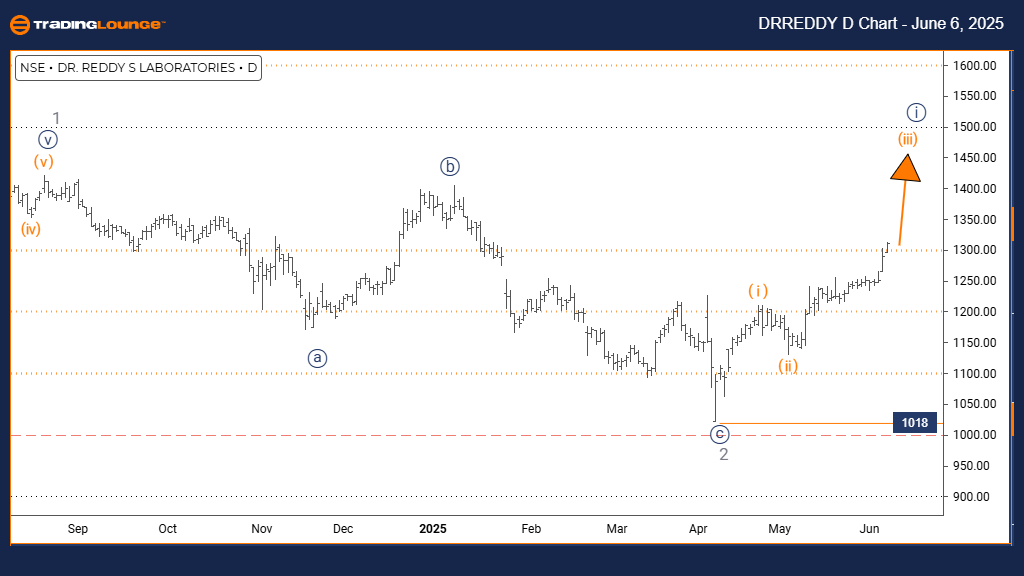
Dr Reddy Laboratories Elliott Wave technical analysis
Function: Bullish Trend.
Mode: Impulsive.
Structure: Orange Wave 3.
Position: Navy Blue Wave 1.
Direction next lower degrees: Orange Wave 4.
Details: Orange wave 2 appears complete; orange wave 3 is now progressing.
Wave cancel invalidation level: 1018.
The daily Elliott Wave analysis for Dr Reddy Laboratories highlights a bullish trend with current market action in an impulsive phase. Orange wave 3 is unfolding within a broader navy blue wave 1 structure. This setup signals a strong uptrend, as orange wave 3 typically represents a dynamic move in an Elliott sequence.
Following the conclusion of orange wave 2, orange wave 3 is advancing, indicating renewed buying strength. A corrective pullback in orange wave 4 is expected next, but for now, upward momentum is intact. The key invalidation level is set at 1018. If prices drop below this point, the current wave structure will require revision.
In summary, the market outlook remains positive. Traders should track the continuation of orange wave 3, while maintaining awareness of the invalidation point. The impulsive nature of the current movement suggests potential for additional gains before a corrective wave 4 retracement.
Day chart
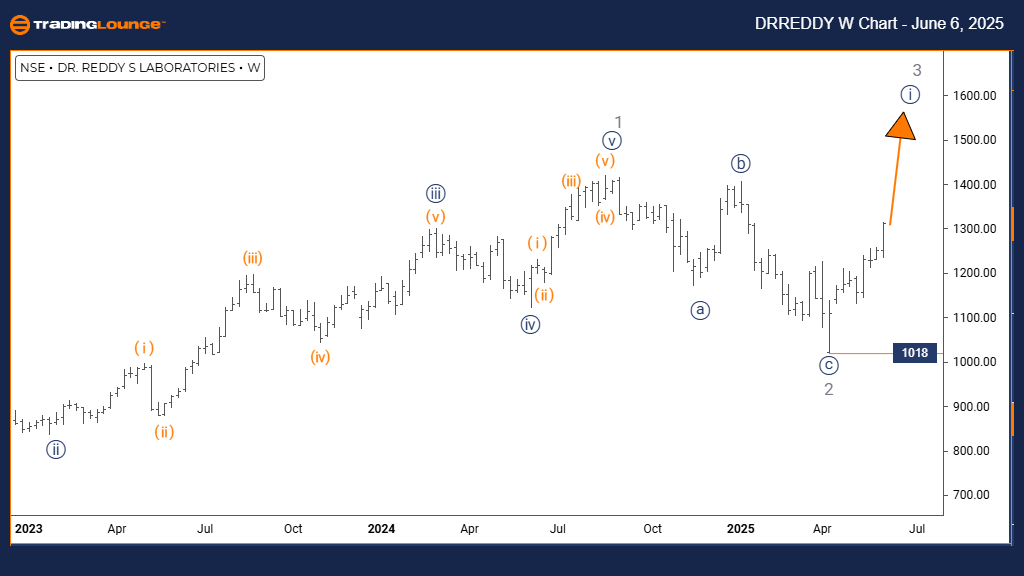
Dr Reddy Laboratories Elliott Wave technical analysis
Function: Bullish Trend.
Mode: Impulsive.
Structure: Navy Blue Wave 1.
Position: Gray Wave 3.
Direction next higher degrees: Navy Blue Wave 1 (started).
Details: Gray wave 2 appears complete; navy blue wave 1 of gray wave 3 is now active.
Wave cancel invalidation level: 1018.
On the weekly chart, Dr Reddy Laboratories continues in a bullish impulsive wave. The market is currently moving within navy blue wave 1, which forms part of the broader gray wave 3. This alignment suggests the start of a long-term upward move.
Gray wave 2 has concluded, and navy blue wave 1 is progressing, indicating fresh upside momentum. The next wave to monitor is also navy blue wave 1, just initiating within gray wave 3. If price falls below 1018, the wave count would be invalidated.
This setup implies sustained upward movement. As long as prices remain above 1018, the bullish outlook holds. Traders and investors should observe the market closely for confirmation of continued impulsive behavior.
Weekly chart
Dr Reddy Laboratories Elliott Wave technical analysis
Author

Peter Mathers
TradingLounge
Peter Mathers started actively trading in 1982. He began his career at Hoei and Shoin, a Japanese futures trading company.


