Dow Jones Industrial Average reverses course after fresh all-time high, sheds 200 points
- Dow Jones briefly tipped into a new record high, but cautious tones remain.
- Fedspeak dominates headlines on quiet Monday, risk appetite hesitates.
- Rate markets still bet on September rate cut, but odds are easing.

The Dow Jones Industrial Average (DJIA) tested into a new all-time record high on Monday, but price action reversesd course and dragged the index to its worst-performing day since the end of April. Federal Reserve (Fed) officials are appearing in force to kick off the new week, with a slew of policymakers giving cautious comments on Monday. Further comments from Fed officials are expected on Tuesday.
Key inflation data eased slightly below expectations last week, pinning broad-market hopes for Fed rate cuts higher. Despite a better-than-expected inflation print last week, price growth remains well above the Fed’s 2% annualized target. Key Fed members remain concerned that progress on inflation may be stalling out.
Read more: Fed officials speak cautiously on policy outlook after April inflation report
The latest Meeting Minutes from the Fed’s Federal Open Market Committee (FOMC) will be published this week, followed by US Purchasing Managers Index (PMI) figures. New and used Home Sales as well as Durable Goods are due later in the week.
The CME’s FedWatch Tool shows rate markets are still pricing in at least 25 basis points in rate cuts from the September Fed rate meeting, but odds are slipping back. At current cut, rate traders are pricing in around 63% odds of a quarter-point cut in September.
Dow Jones news
The Dow Jones lost half of a percent on Monday, ending at 39,806.77 and shedding almost 200 points. 20 of the 30 securities that make up the Dow Jones ended Monday in the red, with JPMorgan Chase & Co. (JPM) taking top spot as the day's loss leader, tumbling -4.5% as investors second-guess steep buying pressure dragged the banking stock to a 52-week high recently. JPM lost nearly ten points and ended Monday at $195.58 per share.
On the up side, Caterpillar Inc. (CAT) gained 1.82%, ending Monday at $362.75 per share. Caterpillar was closely followed by Microsoft Corp. (MSFT) which climbed 1.22% to $425.34 per share after the tech company announced a new line of AI-powered computer devices.
Dow Jones technical outlook
The Dow Jones clipped into a fresh all-time high of 40,070.82 on Monday before cautious investors dragged the mega cap index back down to 39,800.00. Despite softening bids to kick off the new trading week, the DJIA remains firmly-planted in bull country.
The Dow Jones is still up nearly 6% in 2024, and is trading well above the 200-day Exponential Moving Average (EMA) at 37,090.37.
Dow Jones five-minute chart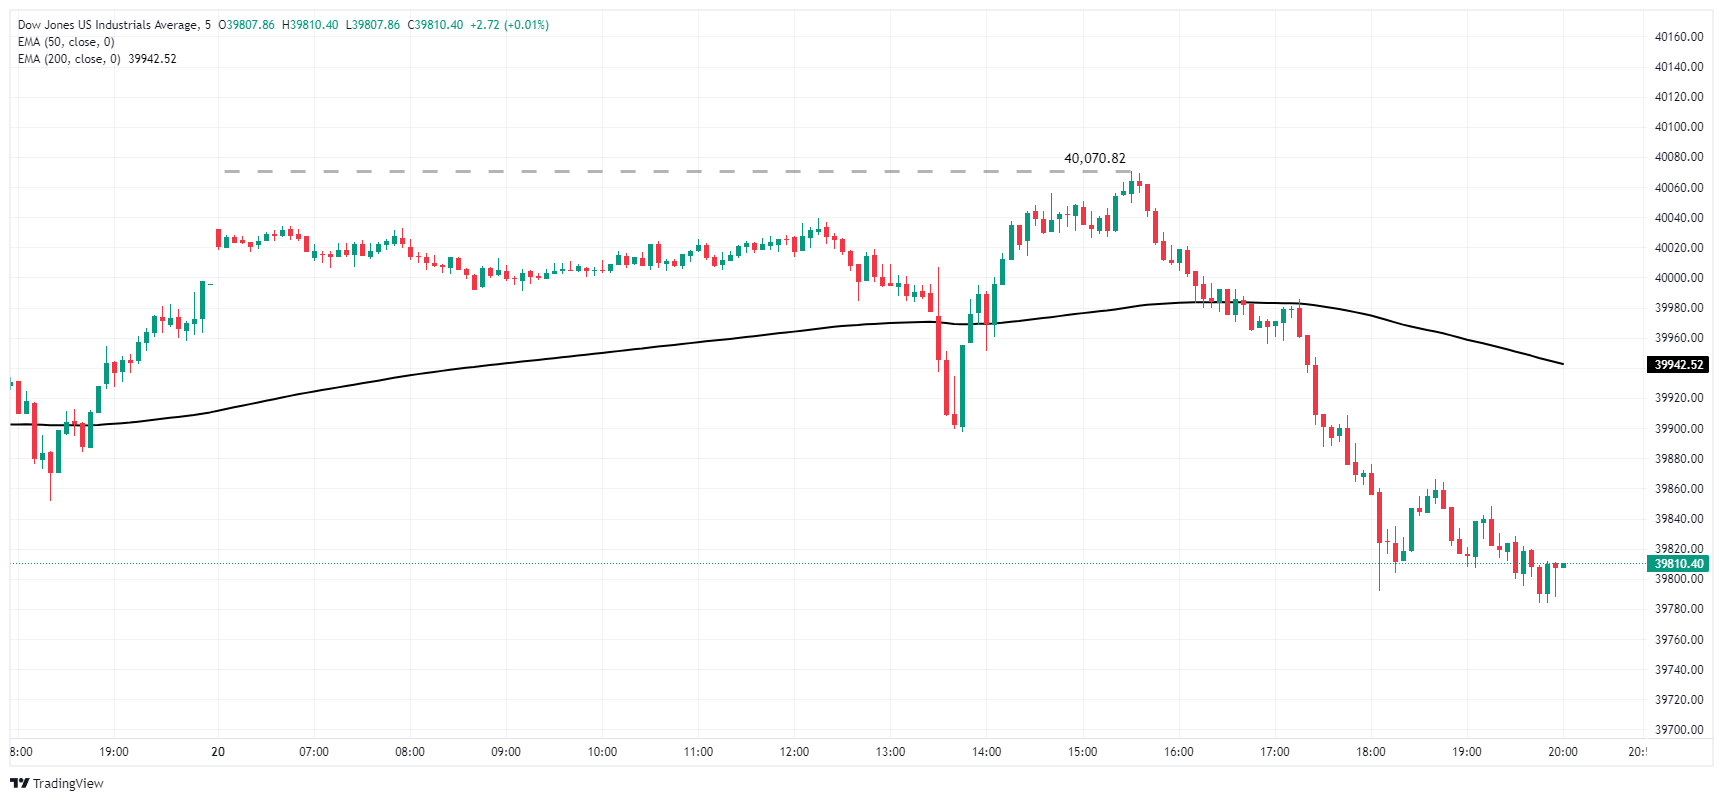
Dow Jones daily chart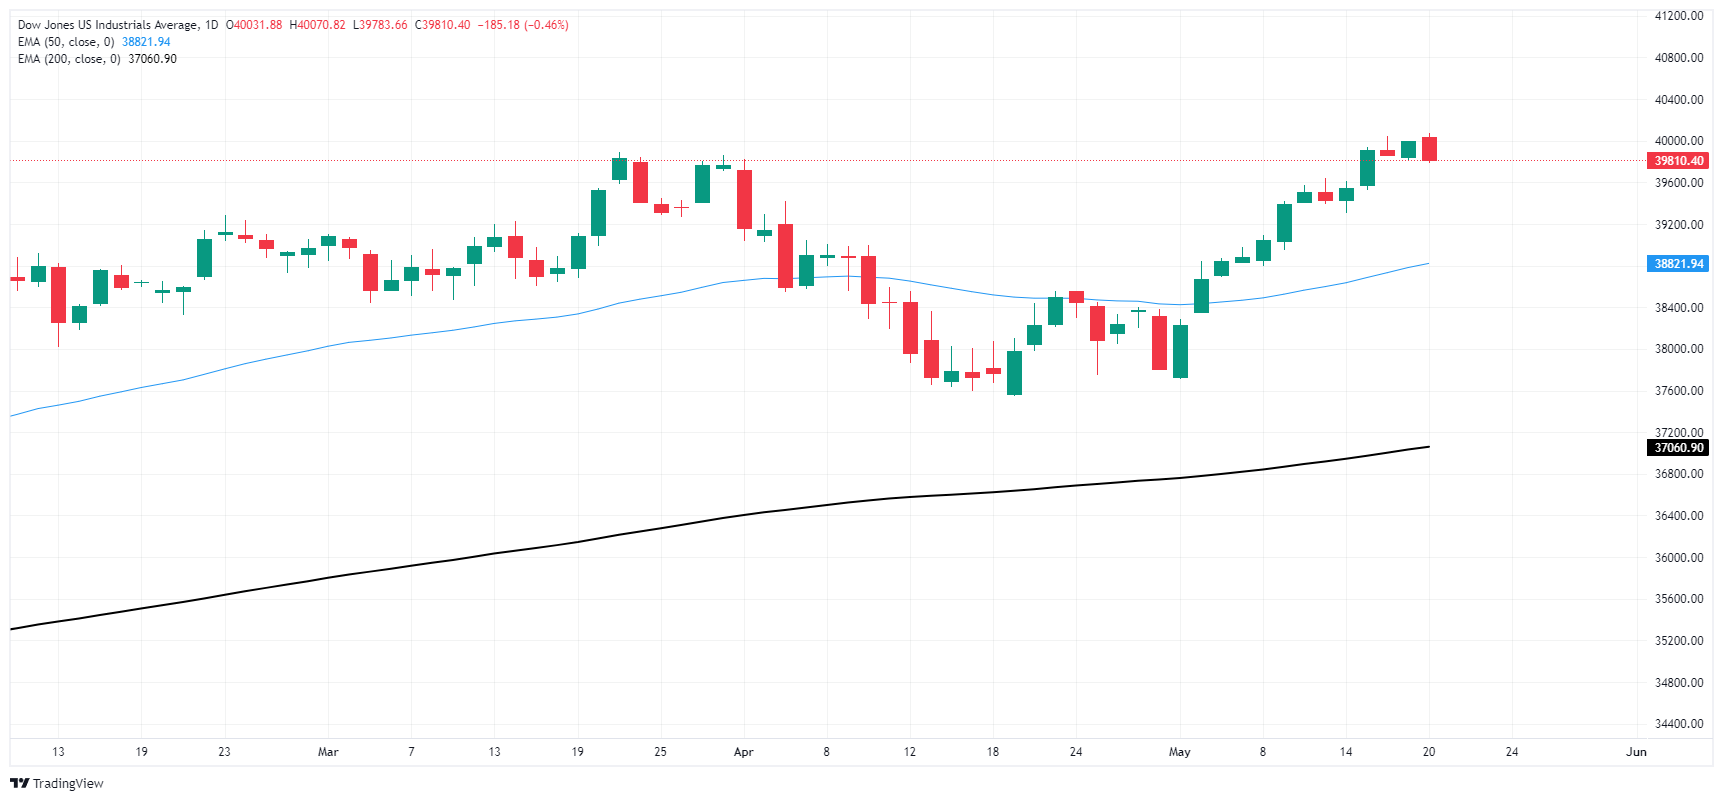
Dow Jones FAQs
The Dow Jones Industrial Average, one of the oldest stock market indices in the world, is compiled of the 30 most traded stocks in the US. The index is price-weighted rather than weighted by capitalization. It is calculated by summing the prices of the constituent stocks and dividing them by a factor, currently 0.152. The index was founded by Charles Dow, who also founded the Wall Street Journal. In later years it has been criticized for not being broadly representative enough because it only tracks 30 conglomerates, unlike broader indices such as the S&P 500.
Many different factors drive the Dow Jones Industrial Average (DJIA). The aggregate performance of the component companies revealed in quarterly company earnings reports is the main one. US and global macroeconomic data also contributes as it impacts on investor sentiment. The level of interest rates, set by the Federal Reserve (Fed), also influences the DJIA as it affects the cost of credit, on which many corporations are heavily reliant. Therefore, inflation can be a major driver as well as other metrics which impact the Fed decisions.
Dow Theory is a method for identifying the primary trend of the stock market developed by Charles Dow. A key step is to compare the direction of the Dow Jones Industrial Average (DJIA) and the Dow Jones Transportation Average (DJTA) and only follow trends where both are moving in the same direction. Volume is a confirmatory criteria. The theory uses elements of peak and trough analysis. Dow’s theory posits three trend phases: accumulation, when smart money starts buying or selling; public participation, when the wider public joins in; and distribution, when the smart money exits.
There are a number of ways to trade the DJIA. One is to use ETFs which allow investors to trade the DJIA as a single security, rather than having to buy shares in all 30 constituent companies. A leading example is the SPDR Dow Jones Industrial Average ETF (DIA). DJIA futures contracts enable traders to speculate on the future value of the index and Options provide the right, but not the obligation, to buy or sell the index at a predetermined price in the future. Mutual funds enable investors to buy a share of a diversified portfolio of DJIA stocks thus providing exposure to the overall index.
Author

Joshua Gibson
FXStreet
Joshua joins the FXStreet team as an Economics and Finance double major from Vancouver Island University with twelve years' experience as an independent trader focusing on technical analysis.















