Dow Jones Industrial Average declines as traders revolt against Trump tariffs
- The Dow Jones is struggling to find its feet after steep overnight losses.
- US equities have taken a haircut after the Trump administration’s tariff announcements.
- Rate markets are now at loggerheads with growth and inflation realities.

The Dow Jones Industrial Average (DJIA) bottomed out near the 40,800 level after taking a steep plunge during overnight markets. Investor sentiment has whipsawed in the face of the Trump administration sweeping tariffs package announced this week, knocking equities into fresh lows.
The Dow Jones fell around 1,300 points from the previous day’s closing bids, tumbling over 3% to break down below the 41,000 handle for the second time in just four weeks. The Standard & Poor’s hit seven-month lows, falling 225 points from Wednesday’s ending prices, shedding 4% through the overnight session and through Thursday’s US markets. The tech-heavy Nasdaq Composite took the heaviest beating of the major equity indexes, plummeted 1,150 points and shedding nearly 6% peak-to-trough through the midweek sessions.
Read more stock news: Amazon stock craters as tariffs take toll on market
The Trump administration’s “Liberation Day” tariff proposals have sparked backlash across the globe, with former US Treasury Secretary Larry Summers accusing the government of computing tariffs without tariff data. This accusation is functionally accurate according to the Trump team’s own publications on tariff calculations, which largely involve dividing a country’s net exports to the US by their imports from the US, and then dividing that number in half, with a minimum tariff floor of 10%. This explains how the US is able to impose 10% “reciprocal” tariffs on the territory of Heard Island and McDonald Islands, which is populated entirely by penguins and zero humans.
US President Donald Trump has signed off on a flat 10% tariff on all goods imported into the US to take effect on April 5. Calculated “reciprocal” tariffs are expected to kick in on April 9.
The pain train is just getting started, according to the Fitch Ratings agency, which cautioned that US economic growth will be even lower than the rating agency’s own already-downgraded forecast in March. Downside impacts from the Trump tariffs are expected to spread to the Federal Reserve (Fed), which Fitch Ratings warned is likely to hold off on interest rate cuts for even longer than expected as the US central bank waits to see the inflation and employment impacts of US tariffs.
To their credit, still-spunky interest rate traders remain undeterred: according to the CME’s FedWatch Tool, rate swap markets are pricing in a total of four rate cuts from the Fed through the remainder of the year. However, Fed officials have ramped up their cautious rhetoric recently in an attempt to temper rate cut hopes.
US ISM Services Purchasing Managers Index (PMI) figures through March were the icing on the bitter cake on Thursday, falling to a nine-month low of 50.8 and declining at one of its fastest month-on-month rates since the pandemic. Business activity and consumer confidence have been evaporating in the run-up to the Trump administration’s tariffs, and the results are unlikely to see sentiment recover quickly.
Dow Jones price forecast
The bottom looks ready to fall out of the Dow Jones chart: the DJIA hit a new seven-month low on Thursday, with the major equity index closing in the red more often than not on a weekly basis since mid-February. The 200-day Exponential Moving Average (EMA) near 42,065 is poised to act as a technical ceiling instead of a floor with price action trading on the south side of the key moving average through most of March.
Dow Jones daily chart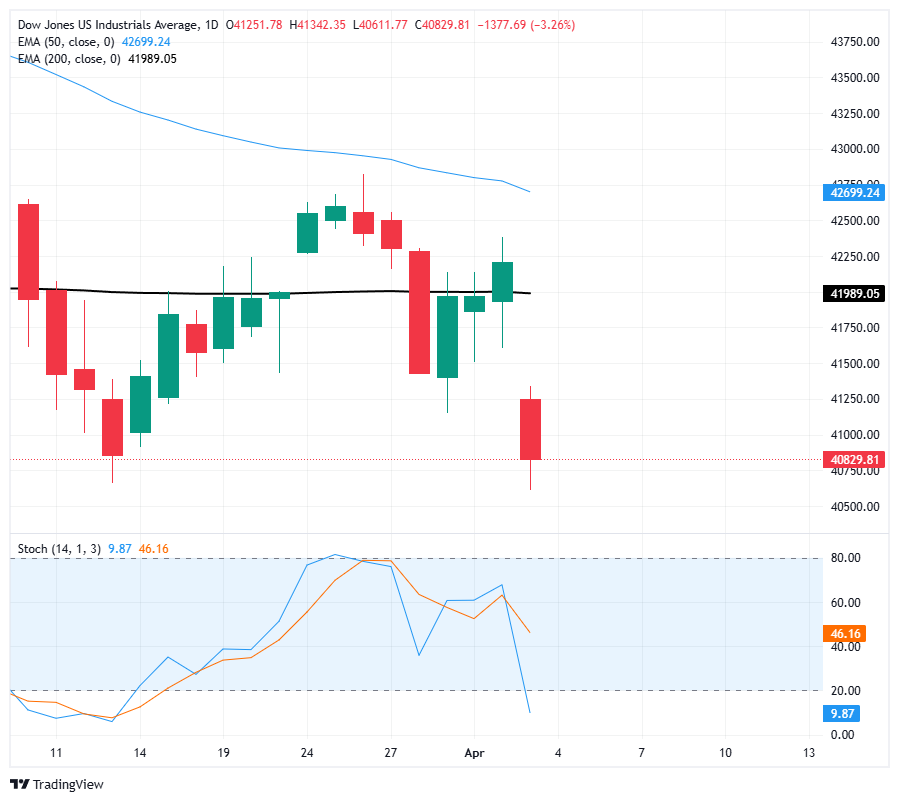
Dow Jones FAQs
The Dow Jones Industrial Average, one of the oldest stock market indices in the world, is compiled of the 30 most traded stocks in the US. The index is price-weighted rather than weighted by capitalization. It is calculated by summing the prices of the constituent stocks and dividing them by a factor, currently 0.152. The index was founded by Charles Dow, who also founded the Wall Street Journal. In later years it has been criticized for not being broadly representative enough because it only tracks 30 conglomerates, unlike broader indices such as the S&P 500.
Many different factors drive the Dow Jones Industrial Average (DJIA). The aggregate performance of the component companies revealed in quarterly company earnings reports is the main one. US and global macroeconomic data also contributes as it impacts on investor sentiment. The level of interest rates, set by the Federal Reserve (Fed), also influences the DJIA as it affects the cost of credit, on which many corporations are heavily reliant. Therefore, inflation can be a major driver as well as other metrics which impact the Fed decisions.
Dow Theory is a method for identifying the primary trend of the stock market developed by Charles Dow. A key step is to compare the direction of the Dow Jones Industrial Average (DJIA) and the Dow Jones Transportation Average (DJTA) and only follow trends where both are moving in the same direction. Volume is a confirmatory criteria. The theory uses elements of peak and trough analysis. Dow’s theory posits three trend phases: accumulation, when smart money starts buying or selling; public participation, when the wider public joins in; and distribution, when the smart money exits.
There are a number of ways to trade the DJIA. One is to use ETFs which allow investors to trade the DJIA as a single security, rather than having to buy shares in all 30 constituent companies. A leading example is the SPDR Dow Jones Industrial Average ETF (DIA). DJIA futures contracts enable traders to speculate on the future value of the index and Options provide the right, but not the obligation, to buy or sell the index at a predetermined price in the future. Mutual funds enable investors to buy a share of a diversified portfolio of DJIA stocks thus providing exposure to the overall index.
Author

Joshua Gibson
FXStreet
Joshua joins the FXStreet team as an Economics and Finance double major from Vancouver Island University with twelve years' experience as an independent trader focusing on technical analysis.


