Dow Jones Industrial Average climbs despite tech sellof
- The Dow Jones is looking to pare recent losses, but topside momentum remains limited.
- Investors are pivoting out of popular tech rally favorites, dragging equity markets lower.
- The Dow is keeping on balance as investors rotate into non-tech darlings.

The Dow Jones Industrial Average (DJIA) skirted Monday’s broad-market declines as investors gave a second thought to their bullish outlook on the long-run tech sector rally. The Dow gained roughly 300 points to kick off the trading week, while the other major equity indexes shed weight.
Investor hopes for continued rate cuts from the Federal Reserve (Fed) have been swirling the drain since the start of the new trading year and last Friday’s bumper Nonfarm Payrolls (NFP) sealed the deal on the Fed being in no rush to deliver more rate reductions. With a bumping US workforce and inflation pressures continuing to simmer in the background, there is little reason for the Fed to race into further moves on rates. To their credit, Fed policymakers have been warning markets for over a year that neutral rates have definitely moved higher since the pandemic and near-zero rate days of the early 2010s, and now it looks like that fact is finally taking hold in investors’ minds.
A fresh batch of US inflation figures are due this week: US Producer Price Index (PPI) inflation is due on Tuesday and the Consumer Price Index (CPI) is slated for Wednesday. Both figures are expected to tick upwards in the near term, which could further undermine rate cut hopes. Retail Sales figures for December will land on Thursday, and the figure is expected to shift lower but remain in healthy consumer spending territory.
Dow Jones news
Despite a broad-market pullback out of tech stock, over half of the Dow Jones is testing into the high side on Monday, with gains being led by a fresh bout of bidding in UnitedHealth Group (UNH), which is recovering from a December bear run that dragged the health sector stock down from record highs above $600. UNH is up over 4% at the time of writing, breaking above $543 per share.
On the low side, Nvidia (NVDA) just can’t catch a break, declining another 2.3% and trading south of $133 per share. Forecasters of tech sector stocks, which are hinged entirely around the AI tech craze, have decided that Nvidia will miss out on future earnings in the AI space as competitors sweep in and take market share from the chipmaker. The fact that the AI tech space is entirely dependent on a massive pipeline of investment funds with little to no revenue to speak of is only a minor factor as traders focus on companies situated to service the exorbitant spending habits of large-scale data modelers driving the AI space.
Dow Jones price forecast
The Dow Jones is catching a thin bid on Monday, pushing back upwards after a decline into the 42,000 handle. The major equity index has drifted nearly 7.5% top-to-bottom into the bearish side after tapping record peaks just above 45,000.
Despite recent bear moves, the Dow Jones is still holding north of the 200-day Exponential Moving Average (EMA), but only just. The Dow is due for a bit of a breather after outpacing the long-run moving average since November of 2023 and closing in the green for ten of the last thirteen straight months.
Dow Jones daily chart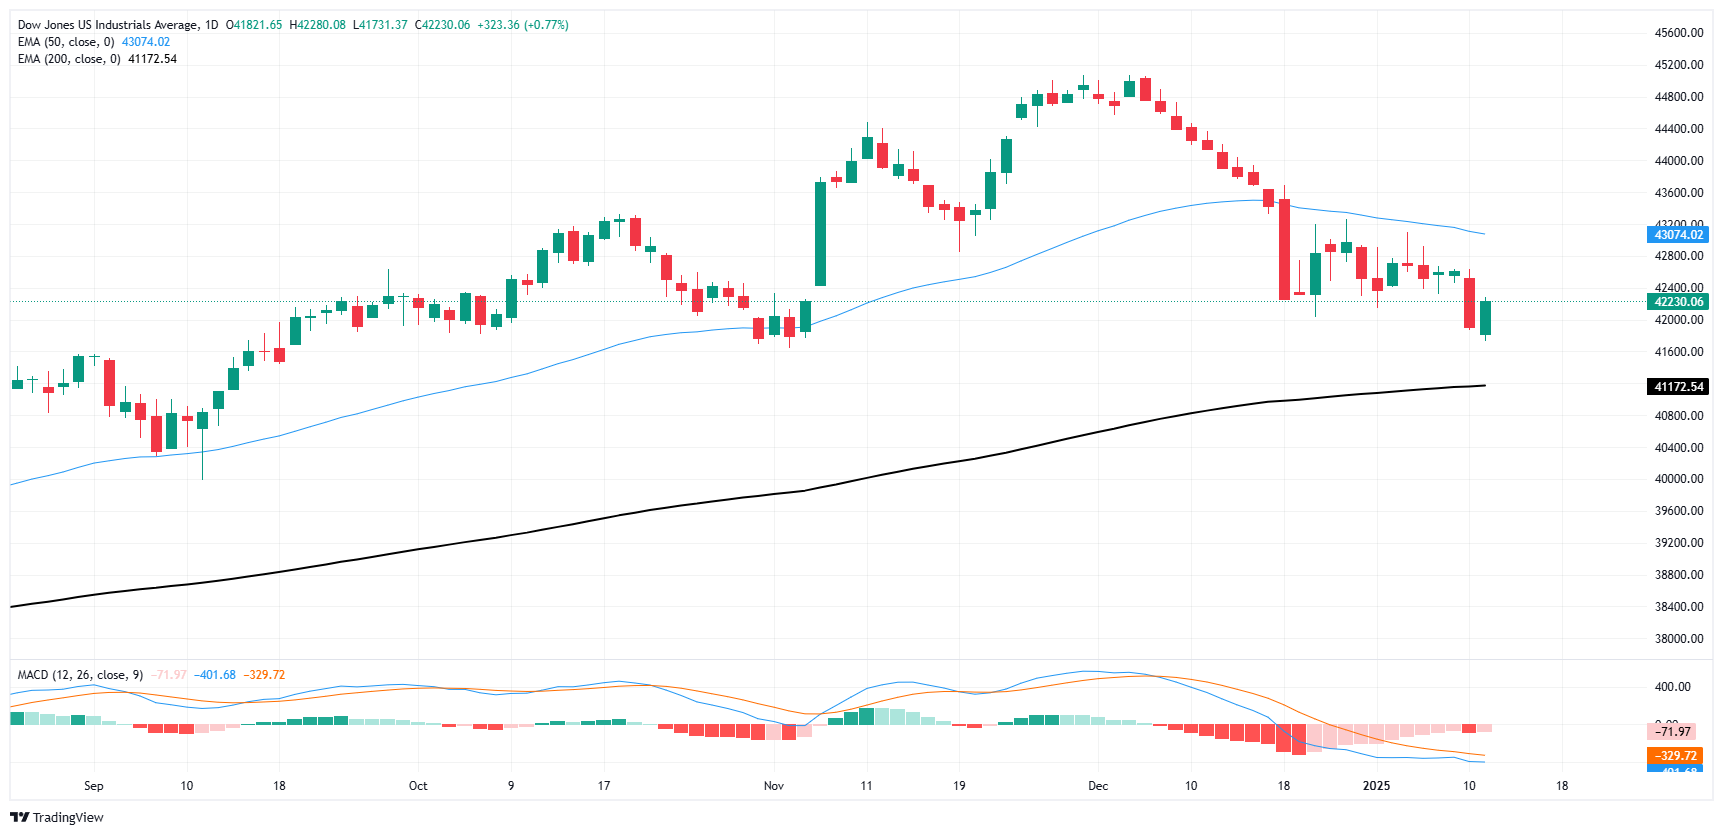
Economic Indicator
Producer Price Index (YoY)
The Producer Price Index released by the Bureau of Labor statistics, Department of Labor measures the average changes in prices in primary markets of the US by producers of commodities in all states of processing. Changes in the PPI are widely followed as an indicator of commodity inflation. Generally speaking, a high reading is seen as positive (or bullish) for the USD, whereas a low reading is seen as negative (or bearish).
Read more.Next release: Tue Jan 14, 2025 13:30
Frequency: Monthly
Consensus: 3.4%
Previous: 3%
Source: US Bureau of Labor Statistics
Author

Joshua Gibson
FXStreet
Joshua joins the FXStreet team as an Economics and Finance double major from Vancouver Island University with twelve years' experience as an independent trader focusing on technical analysis.

















