Dow Jones Industrial Average tumbles 640 points as tariff threats weigh on markets
- The Dow Jones backslid on Monday, falling 740 points.
- Equity markets await the latest news on Trump tariff plans; details are expected on Tuesday.
- Manufacturing expectations dipped again, but price worries continue to rise.

The Dow Jones Industrial Average (DJIA) spun in a worried circle on Monday, opening the gates on a new trading week and holding near the 43,800 level before ongoing investor worries took hold and dragged the DJIA lower by around 740 points at its lowest and ending Monday's US market session 640 points in the red. The major equity index continues to churn out a volatility-burdened pattern near key moving averages as investors await the latest iteration of United States (US) President Donald Trump’s tariff threats. Paradoxically, Trump’s tariffs are claimed to be both a masterful negotiating tactic by the Republican platform runner who doesn’t actually intend to impose import taxes on his own citizens, but also a critically necessary form of revenue generation for the US government that will be getting imposed no matter what. Whichever form the tariffs take tend to depend on who in the Trump administration is talking.
US President Donald Trump: 25% tariffs on Canada and Mexico to start Tuesday
PMI figures miss the mark ahead of another NFP Friday
Another Nonfarm Payrolls (NFP) week is on the books, with Friday’s key jobs data looming ahead. Things are off to a soft start after US ISM Purchasing Managers Index (PMI) survey results came in softer than expected. According to a sampling of key business operators, business activity expectations for March shrank slightly, with the ISM Manufacturing PMI falling to 50.3. The economic indicator is still holding above the key 50.0 level that typically separates contraction versus expansion expectations, but the one-month fall from February’s 50.9 accelerated through median market forecasts of a slight trim to 50.5.
US ISM Manufacturing Prices Paid accelerated however, bringing renewed inflation fears back into the picture. The indicator rose to nearly a two-year high as tariff fears continue to squeeze higher price pressures into the market. ISM Prices Paid expectations rose to 62.4 in March, rising from the previous print of 50.9 and blowing through the forecast of 56.2.
Dow Jones news
The Dow Jones started Monday on an almost hopeful note, but fresh social media posts from US President Donald Trump ended the day's bullish potential, and now the majority of the DJIA is testing into the red. Reports surfaced that Nvidia (NVDA) products have been making their way to China despite US restrictions on Chinese access to US-produced microchips. Singapore is officially probing some of Nvidia’s key customers, including Dell (DELL) and Super Micro Computer (SMCI), who may have been putting Nvidia’s latest chipset, Blackwell, into servers and then shipping them to China in order to subvert export restrictions. Nvidia is down around 9%, tumbling below $114 per share.
Dow Jones price forecast
The Dow Jones continues to churn into the 50-day Exponential Moving Average (EMA) at 43,850, and price action is set for further downside explorations after the latest swing low found the 43,200 level. The DJIA is still holding well into bull country on the north side of the 200-day EMA at 42,100, however the ongoing bullish trend is beginning to grow long in the tooth. It has been 14 consecutive trading weeks since the Dow Jones set a new all-time high, and signs of exhaustion are beginning to set in as bidders get used to trading below the 44,000 handle.
Dow Jones daily chart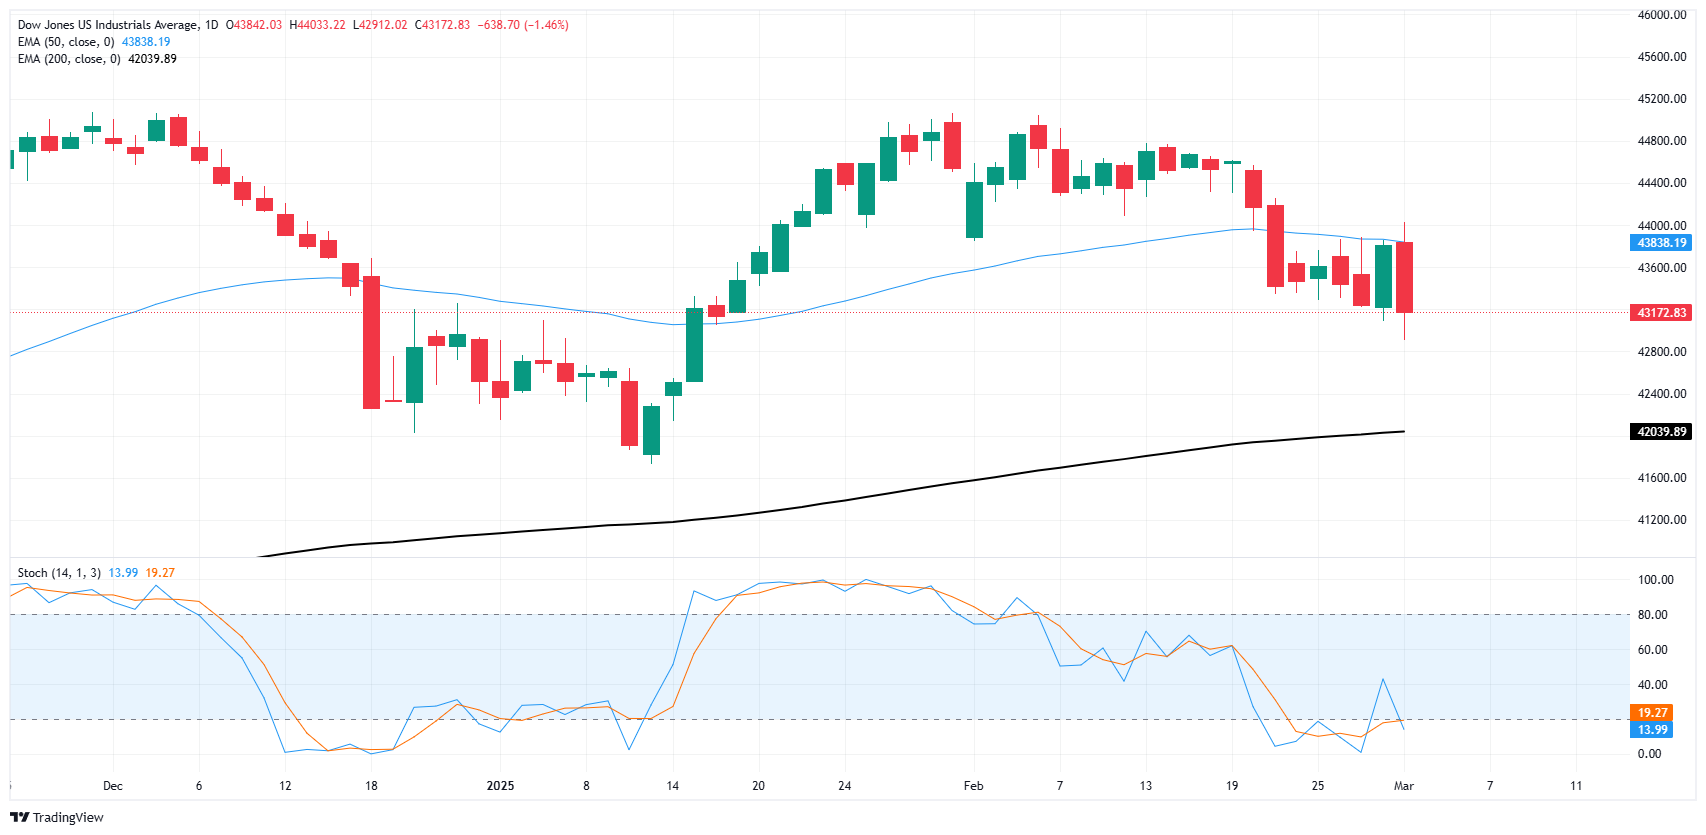
Dow Jones FAQs
The Dow Jones Industrial Average, one of the oldest stock market indices in the world, is compiled of the 30 most traded stocks in the US. The index is price-weighted rather than weighted by capitalization. It is calculated by summing the prices of the constituent stocks and dividing them by a factor, currently 0.152. The index was founded by Charles Dow, who also founded the Wall Street Journal. In later years it has been criticized for not being broadly representative enough because it only tracks 30 conglomerates, unlike broader indices such as the S&P 500.
Many different factors drive the Dow Jones Industrial Average (DJIA). The aggregate performance of the component companies revealed in quarterly company earnings reports is the main one. US and global macroeconomic data also contributes as it impacts on investor sentiment. The level of interest rates, set by the Federal Reserve (Fed), also influences the DJIA as it affects the cost of credit, on which many corporations are heavily reliant. Therefore, inflation can be a major driver as well as other metrics which impact the Fed decisions.
Dow Theory is a method for identifying the primary trend of the stock market developed by Charles Dow. A key step is to compare the direction of the Dow Jones Industrial Average (DJIA) and the Dow Jones Transportation Average (DJTA) and only follow trends where both are moving in the same direction. Volume is a confirmatory criteria. The theory uses elements of peak and trough analysis. Dow’s theory posits three trend phases: accumulation, when smart money starts buying or selling; public participation, when the wider public joins in; and distribution, when the smart money exits.
There are a number of ways to trade the DJIA. One is to use ETFs which allow investors to trade the DJIA as a single security, rather than having to buy shares in all 30 constituent companies. A leading example is the SPDR Dow Jones Industrial Average ETF (DIA). DJIA futures contracts enable traders to speculate on the future value of the index and Options provide the right, but not the obligation, to buy or sell the index at a predetermined price in the future. Mutual funds enable investors to buy a share of a diversified portfolio of DJIA stocks thus providing exposure to the overall index.
Author

Joshua Gibson
FXStreet
Joshua joins the FXStreet team as an Economics and Finance double major from Vancouver Island University with twelve years' experience as an independent trader focusing on technical analysis.


