Dow Jones Industrial Average gains 200 points as Fed Minutes loom and Nvidia rallies on Meta deal
- Nvidia led the Dow higher on an expanded AI chip partnership with Meta, while Palo Alto Networks sank on weak guidance.
- Garmin and Wingstop delivered blowout earnings beats, while investors braced for the afternoon release of January FOMC minutes.
- Gold pushes above $5,000 per ounce and Crude Oil surges more than 2% on geopolitical tensions.

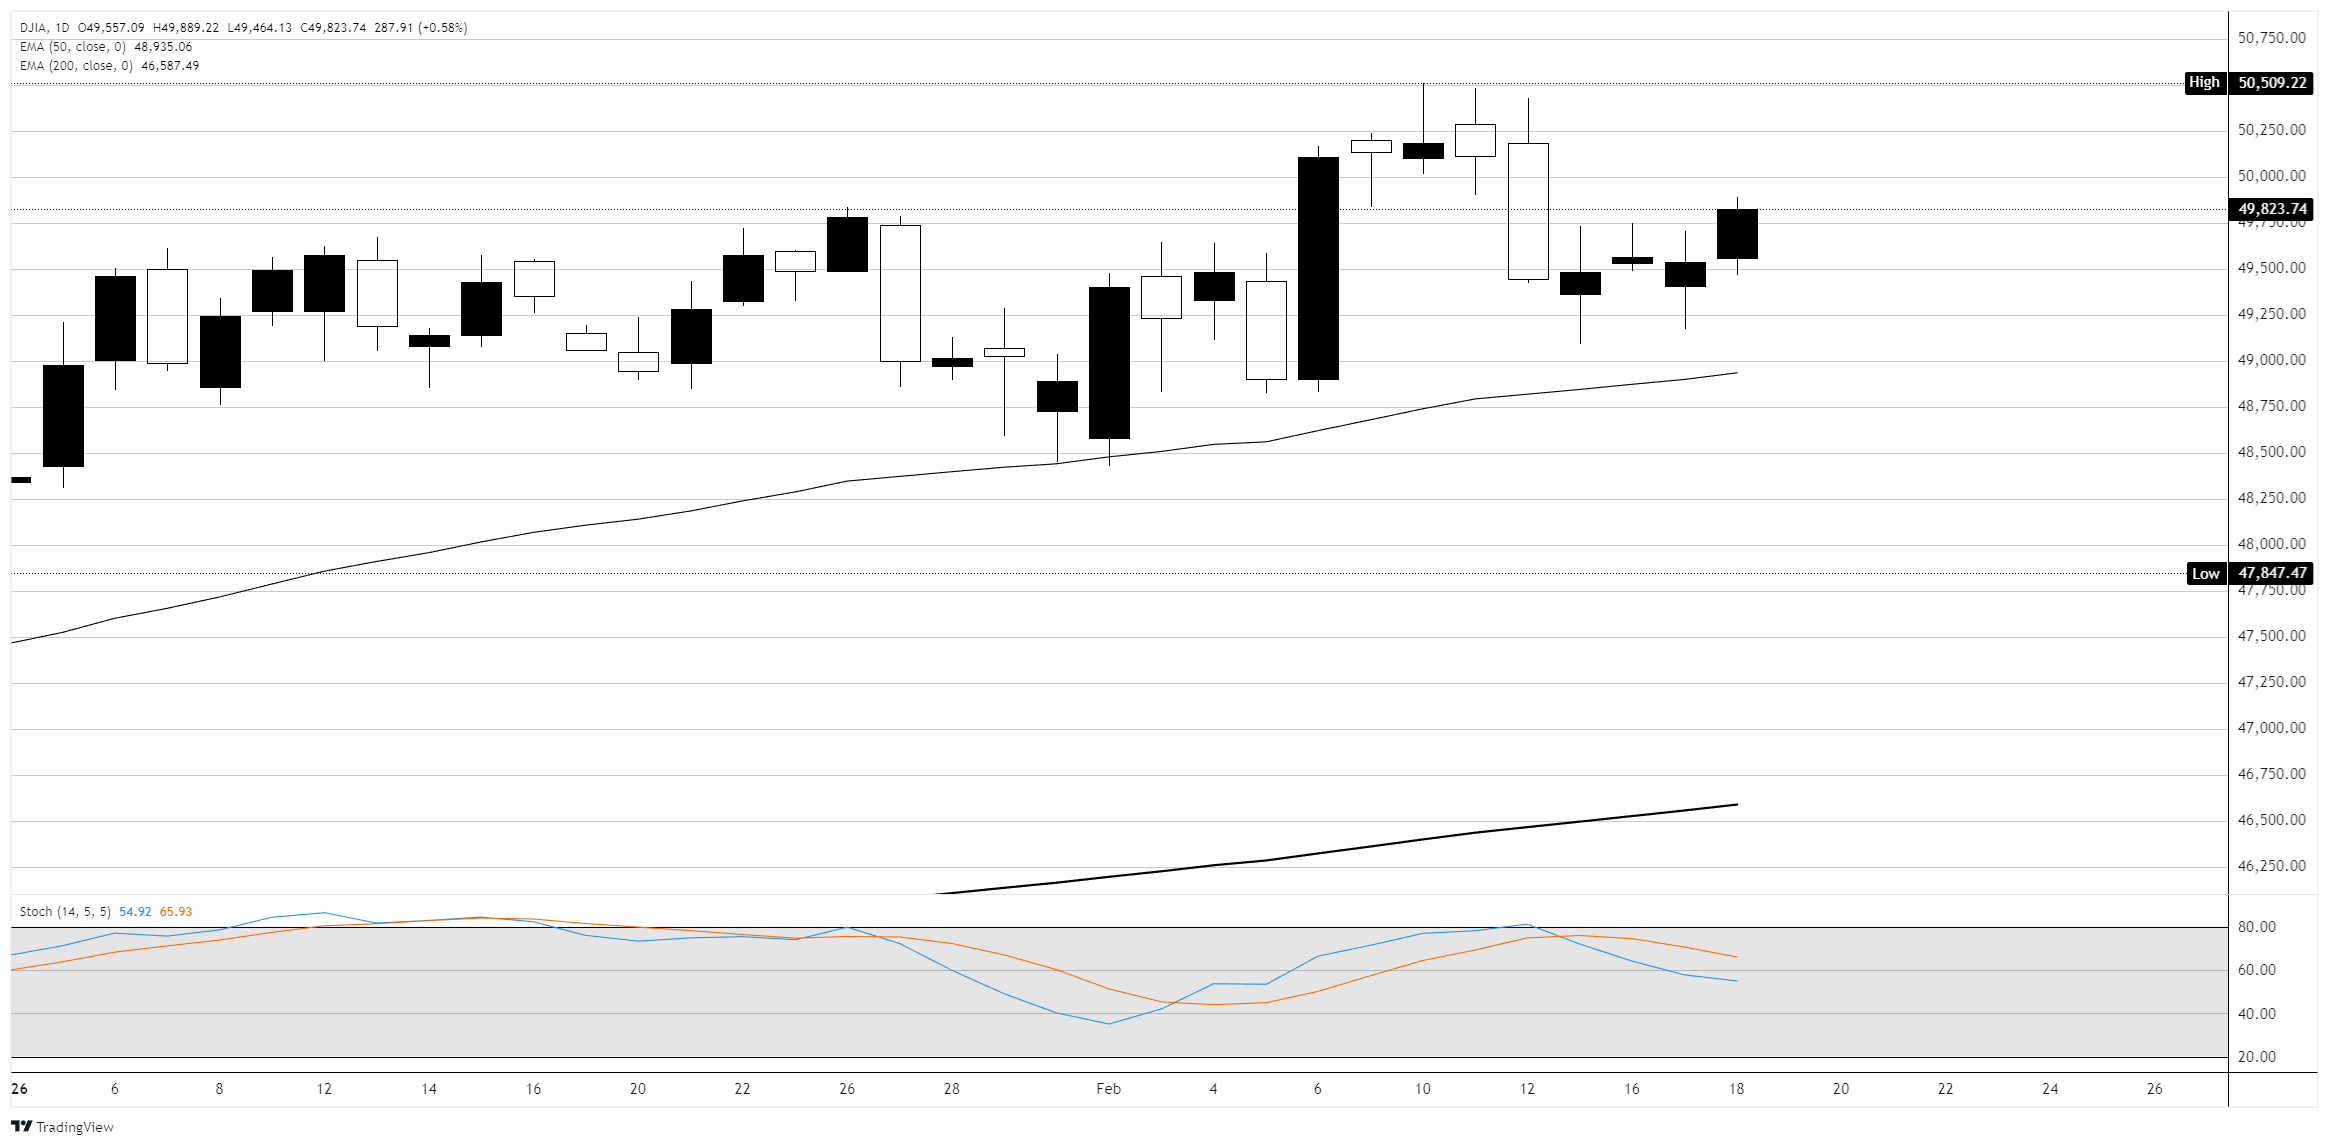
The Dow Jones Industrial Average (DJIA) climbed around 300 points, or about 0.65%, on Wednesday as dip buyers continued stepping back into equities for a third consecutive session this week following last week's sharp AI-driven selloff. The S&P 500 rose 0.6% and the Nasdaq Composite gained around 0.5%, with chipmakers and beaten-down mega-cap tech names leading the charge. Investors are keeping one eye on the afternoon release of the Federal Reserve's (Fed) January meeting minutes at 2:00 PM ET, which may offer clues on the central bank's rate path for the remainder of 2026. The Fed held rates at 3.50% to 3.75% at its January meeting, and markets are pricing in roughly a 90% chance of no change in March, with the CME FedWatch Tool showing the first rate cut of the year isn't expected until June at the earliest.
Nvidia surges on expanded Meta partnership
Nvidia Corporation (NVDA) jumped over 2% and was among the top gainers on the Dow after Meta Platforms Inc. (META) announced a sweeping expansion of its AI chip partnership with the chipmaker. Meta will deploy millions of Nvidia chips across its US data centers, including Nvidia's new standalone Grace CPUs and next-generation Vera Rubin GPU systems, in a deal analysts described as being worth tens of billions. The partnership boosted sentiment across the semiconductor space, though the news hit Advanced Micro Devices Inc. (AMD) particularly hard, with shares sliding nearly 4% as the deal reinforced Nvidia's dominance in the AI data center supply chain. Amazon.com Inc. (AMZN) rose nearly 2% after regulatory filings revealed that Bill Ackman's Pershing Square grew its stake in the e-commerce giant by 65% during the fourth quarter, helping the stock extend its recovery after snapping a nine-day losing streak on Tuesday. Goldman Sachs Group Inc. (GS) led all Dow components higher, gaining nearly 3%.
Palo Alto Networks sinks on guidance miss
Palo Alto Networks Inc. (PANW) tumbled around 10% after the cybersecurity firm's fiscal third-quarter earnings guidance came in well below expectations, overshadowing a solid beat on its second-quarter results. The company reported adjusted earnings per share (EPS) of $1.03 on revenue of $2.59 billion, topping estimates of $0.94 and $2.58 billion, respectively. However, the fiscal Q3 EPS outlook of $0.78 to $0.80 badly missed the $0.92 consensus, weighing on shares that were already down 11% year to date. Analysts pointed to rising integration costs from Palo Alto's $25 billion acquisition of CyberArk and the $3 billion Chronosphere deal as the key culprits behind the profit squeeze. Applied Digital Inc. (APLD) fell nearly 8% after a filing revealed that Nvidia had exited its $177 million stake in the company.
Garmin and Wingstop deliver blowout quarters
Garmin Ltd. (GRMN) surged after reporting fourth-quarter adjusted EPS of $2.79 on revenue of $2.12 billion, crushing estimates of $2.39 and $2.01 billion. The navigation and wearables maker also issued fiscal year 2026 EPS guidance of $9.35, well above the $8.51 consensus, and projected revenue of $7.9 billion versus estimates of $7.4 billion. Separately, Wingstop Inc. (WING) soared more than 13% after the chicken wing chain reported better-than-feared same-store sales and an earnings beat. The company posted adjusted EPS of $1.00 versus estimates of $0.84, while domestic same-store sales declined 5.8% in the fourth quarter, less than the steeper drop analysts had been bracing for. Wingstop guided for flat to low-single-digit domestic same-store sales growth in 2026.
Gold reclaims $5K, Oil spikes on geopolitical risk
Gold climbed above $5,000 per ounce on Wednesday, hovering near a two-week high as expectations for a more accommodative Fed continued to support the precious metal. The People's Bank of China extended its Gold purchases for a 15th consecutive month in January, adding structural demand underneath prices that are still recovering from the late-January crash triggered by the nomination of Kevin Warsh as the next Fed chair. Crude Oil surged more than 2% to nearly $64 per barrel amid heightened tensions around the Russia-Ukraine conflict and reports that Iran is ignoring core US demands in nuclear talks. On the housing front, December housing starts came in at a seasonally adjusted annual rate of 1.4 million, above expectations, though the data was delayed from its original January release date due to the lingering effects of the federal government shutdown earlier this year.
Dow Jones daily chart
Dow Jones FAQs
The Dow Jones Industrial Average, one of the oldest stock market indices in the world, is compiled of the 30 most traded stocks in the US. The index is price-weighted rather than weighted by capitalization. It is calculated by summing the prices of the constituent stocks and dividing them by a factor, currently 0.152. The index was founded by Charles Dow, who also founded the Wall Street Journal. In later years it has been criticized for not being broadly representative enough because it only tracks 30 conglomerates, unlike broader indices such as the S&P 500.
Many different factors drive the Dow Jones Industrial Average (DJIA). The aggregate performance of the component companies revealed in quarterly company earnings reports is the main one. US and global macroeconomic data also contributes as it impacts on investor sentiment. The level of interest rates, set by the Federal Reserve (Fed), also influences the DJIA as it affects the cost of credit, on which many corporations are heavily reliant. Therefore, inflation can be a major driver as well as other metrics which impact the Fed decisions.
Dow Theory is a method for identifying the primary trend of the stock market developed by Charles Dow. A key step is to compare the direction of the Dow Jones Industrial Average (DJIA) and the Dow Jones Transportation Average (DJTA) and only follow trends where both are moving in the same direction. Volume is a confirmatory criteria. The theory uses elements of peak and trough analysis. Dow’s theory posits three trend phases: accumulation, when smart money starts buying or selling; public participation, when the wider public joins in; and distribution, when the smart money exits.
There are a number of ways to trade the DJIA. One is to use ETFs which allow investors to trade the DJIA as a single security, rather than having to buy shares in all 30 constituent companies. A leading example is the SPDR Dow Jones Industrial Average ETF (DIA). DJIA futures contracts enable traders to speculate on the future value of the index and Options provide the right, but not the obligation, to buy or sell the index at a predetermined price in the future. Mutual funds enable investors to buy a share of a diversified portfolio of DJIA stocks thus providing exposure to the overall index.
Author

Joshua Gibson
FXStreet
Joshua joins the FXStreet team as an Economics and Finance double major from Vancouver Island University with twelve years' experience as an independent trader focusing on technical analysis.

















