Dow Jones Industrial Average Forecast: Slightly higher inflation print merely confuses index
- The Dow Jones Industrial Index lost 0.75% last week.
- WTI Oil is nearing $90 on Wednesday after advancing over 1.5% the previous day.
- US Treasury yields rise even more heavily for longer maturities.
- US CPI shows core inflation creeping higher than expected in August.
- Arm IPO should usher in market excitement this week.

The Dow Jones Industrial Average (DJIA) has drifted 0.1% one hour into Wednesday's session, seemingly confused about its direction. Similar to the previous two session this week, there was an attempt to push the market higher in the first half hour, but the 30-stock index sold off after 10:00AM EST.
Before the bell, the US Consumer Price Index (CPI) for August showed slightly higher inflation levels than expected. The ever-important monthly core reading showed inflation rising 0.3% from July rather than the 0.2% reading expected. Also the annualized headline inflation figure of 3.7% was just a hair above the 3.6% consensus number.
The index has been unable to hold onto its rallies so far this week as both Monday and Tuesday witnessed impressive advances give back most of the gains in the afternoon sessions. Oil prices have extended their rally, with WTI having nearly reached $90.
The Arm IPO, which prices on Wednesday but begins trading on Thursday, could lead to an uptick in positive sentiment for the entire equity market as it is reported to be oversubscribed.
Dow Jones News: CPI to set tone for September
The CME Group’s FedWatch Tool gives a 93% chance that the Federal Reserve will keep interest rates flat at its September 20 meeting next Wednesday. The only thing that could change that would be if the August CPI came in hot enough that the central bank determines more tightening is necessary to ensure that inflation does not pick back up.
Inflation did arrive above the consensus forecast early Wednesday, but it was not alarming. The most important reading was the core monthly figure showing 0.3% growth from July to August. Consensus had be 0.2% just like July's reading. However, YoY core inflation was reported as expected at 4.3%, down from the previous month's 4.7%. And despite the annualized headline rate jumping from 3.2% to 3.7%, mostly due to the recent OPEC+ caused rally in worldwide Oil prices, the monthly change arrived at 0.6% as expected.
This August CPI print is not what everyone calling for a soft landing wanted, but it is not exactly alarming. Higher fuel prices will certainly work their way into more goods and services over the last few months of the year. Oil prices have jumped 10% in just the past two weeks but have been on a steady advance since the summer. Then just last week, Saudi Arabia and Russia both extended previously announced cuts to supply, which helped the Oil price rise even further. WTI is trading at $89 at the time of writing.
Oversubscribed Arm Holdings IPO could lead to September tech rally
There appears to be plenty of excitement over the Arm Holdings IPO. The UK company that licenses semiconductor designs found in nearly all smartphones will price on Wednesday and begin trading on Thursday.
Arm is currently entirely owned by Japan’s SoftBank (SFTBY), which wishes to sell about 10% of the company. Initially, Arm floated a range of $47 to $51 a share, which would value itself between $50 billion and $54 billion. The circa $5 billion offering, however, was wholly purchased on its first day after being oversubscribed by Wall Street banks’ clients, and the rumor is that it will be priced toward the top of the range.
Additionally, a large group of Arm’s customers – including Taiwan Semiconductor (TSMC), Apple (AAPL), Alphabet (GOOGL), Advanced Micro Devices (AMD), Nvidia (NVDA), Intel (INTC) and Samsung (SSNLF) – are purchasing approximately $735 million of the offering.
CEO Rene Haas has been making the rounds and has reportedly claimed that Arm will grow revenue in the high teens for the next several years. The strong demand the IPO has received could easily translate on Thursday into a euphoric rally as the retail crowd attempts to take its own bite.
Dow Jones FAQs
What is the Dow Jones?
The Dow Jones Industrial Average, one of the oldest stock market indices in the world, is compiled of the 30 most traded stocks in the US. The index is price-weighted rather than weighted by capitalization. It is calculated by summing the prices of the constituent stocks and dividing them by a factor, currently 0.152. The index was founded by Charles Dow, who also founded the Wall Street Journal. In later years it has been criticized for not being broadly representative enough because it only tracks 30 conglomerates, unlike broader indices such as the S&P 500.
What factors impact the Dow Jones Industrial Average?
Many different factors drive the Dow Jones Industrial Average (DJIA). The aggregate performance of the component companies revealed in quarterly company earnings reports is the main one. US and global macroeconomic data also contributes as it impacts on investor sentiment. The level of interest rates, set by the Federal Reserve (Fed), also influences the DJIA as it affects the cost of credit, on which many corporations are heavily reliant. Therefore, inflation can be a major driver as well as other metrics which impact the Fed decisions.
What is Dow Theory?
Dow Theory is a method for identifying the primary trend of the stock market developed by Charles Dow. A key step is to compare the direction of the Dow Jones Industrial Average (DJIA) and the Dow Jones Transportation Average (DJTA) and only follow trends where both are moving in the same direction. Volume is a confirmatory criteria. The theory uses elements of peak and trough analysis. Dow’s theory posits three trend phases: accumulation, when smart money starts buying or selling; public participation, when the wider public joins in; and distribution, when the smart money exits.
How can I trade the DJIA?
There are a number of ways to trade the DJIA. One is to use ETFs which allow investors to trade the DJIA as a single security, rather than having to buy shares in all 30 constituent companies. A leading example is the SPDR Dow Jones Industrial Average ETF (DIA). DJIA futures contracts enable traders to speculate on the future value of the index and Options provide the right, but not the obligation, to buy or sell the index at a predetermined price in the future. Mutual funds enable investors to buy a share of a diversified portfolio of DJIA stocks thus providing exposure to the overall index.
Dow Jones Industrial Average forecast
The primary takeaway from the daily candlestick chart shown below is that Monday and Tuesday both experienced impressive rallies that both dissipated. The long top wicks below look similar to the three sessions between August 30 and September 1, which ended up foreshadowing a mild pullback in the Dow index.
If the Dow index begins trading further below the 34,600 level, then it may be time to bail. Support comes in at the bottom of that resistance-turned-support range at 34,250 and then beneath there at 34,029.
Bulls will look at how the short-term range low on September 6 amounted to a higher low than the August 25 range low. In other words, this is a bullish sign. The Dow index appears to be closing in line with the 21-day Simple Moving Average (SMA) over recent sessions, so bulls will need to close above there in order to demonstrate their power. That move would allow another run at the 35,200 to 35,750 supply zone.
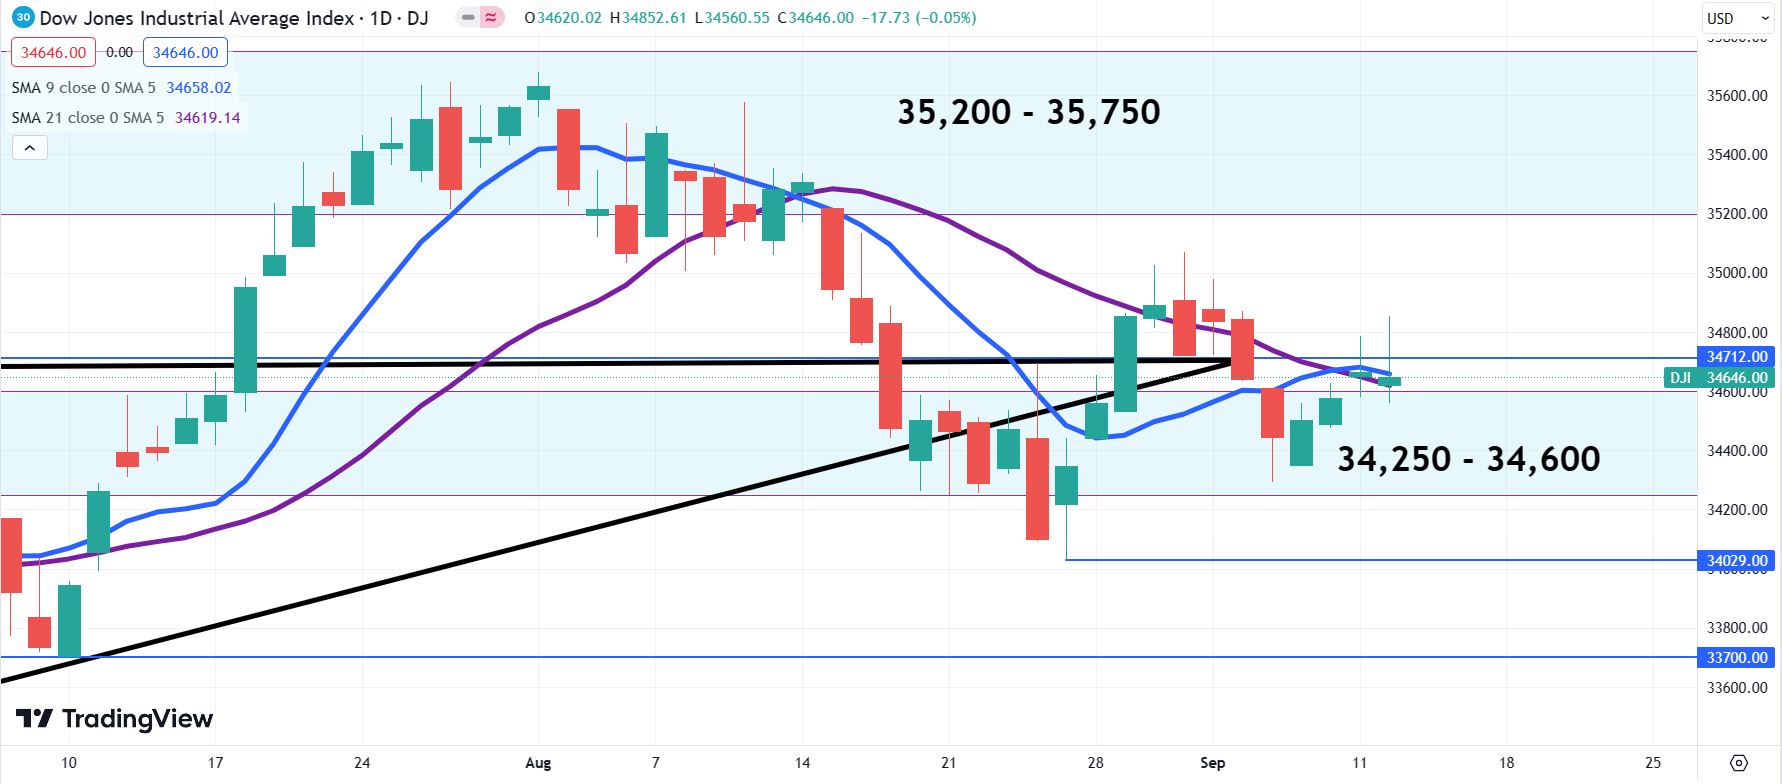
Dow Jones Industrial Average daily chart
Premium
You have reached your limit of 3 free articles for this month.
Start your subscription and get access to all our original articles.
Author

Clay Webster
FXStreet
Clay Webster grew up in the US outside Buffalo, New York and Lancaster, Pennsylvania. He began investing after college following the 2008 financial crisis.


