Dow Jones Industrial Average flatlines on Friday, ends week where it started
- Dow Jones is set to end the week close to where it started.
- The major equity index recovered after Monday's thousand-point plunge, but nothing more.
- Markets now pivot to focus on next week’s inflation data.

The Dow Jones Industrial Average (DJIA) traded mostly flat on Friday, testing the waters near the week’s opening bids after a run of volatility sparked by broad-market concerns that the Federal Reserve (Fed) might have missed the train on rate cuts. A turn towards the softer side in US data prints late last week sparked a risk-off plunge across the global markets, coupled with an unwinding of the Yen carry trade after the Bank of Japan (BoJ) ended favorable rate differentials.
Forecasting the Coming Week: US CPI and Fed’s easing should rule the sentiment
After kicking off the trading week with a thousand-point plunge, the Dow Jones is back to where it started, paddling around 39,400.00. Investor hopes for an “emergency rate cut” from the Fed failed to materialize after markets realized that six-digit US Nonfarm Payrolls jobs growth, unemployment below 5%, steady wage growth, and week-on-week jobless claims within long-term averages may not be the economic disaster it was made out to be last week.
Still, market focus remains squarely on the odds of a September rate cut. Rate markets have fully priced in the start of a rate cutting cycle when the Federal Open Market Committee (FOMC) meets on September 18, but bets of an initial double cut for 50 basis points have eased to slightly-better-than-even from nearly 70% earlier this week. According to the CME’s FedWatch Tool, rate traders are pricing in 53.5% odds of a 50 bps cut in September, with an additional two cuts worth 25 basis points apiece through the remainder of 2024.
Coming up next week, investors will get a fresh batch of inflation data to worry about, with US Producer Price Index (PPI) and Consumer Price Index (CPI) inflation on the cards for Tuesday and Wednesday, respectively. US Retail Sales and another update from the University of Michigan’s Consumer Sentiment Survey Index are also due later next week. Core PPI inflation and headline CPI inflation are both still stuck around 3% YoY, and investors will be hoping for a continued easing in the prints to keep the Fed on the rails toward rate cuts.
Dow Jones news
The Dow Jones remained on balance on Friday, with the index split fairly equally between winners and losers. Intel Inc. (INTC) fell back around 4%, declining below $20.00 per share as the tech company continues to run out of ways to push its otherworldly P/E ratio back above 100.00. After roughly $4 billion in quarterly earnings missed estimates by $150 million, the company doubled down on keeping investors happy by immediately announcing layoffs of 15,000 people.
Dow Jones technical forecast
Friday’s flat-footed candlestick puts the Dow Jones entirely below the 50-day Exponential Moving Average (EMA) for an entire trading week, a feat the index hasn’t accomplished since mid-April’s swing low. The index still remains sharply down from record highs set at 41,371.38 in July, having fallen -7.22% peak-to-trough.
Despite a soft patch, the index is still holding ground in bull country above the 200-day EMA at 38,025.14, and buyers will take any excuse to reignite the furnace and gets bids back into the high side.
Dow Jones daily chart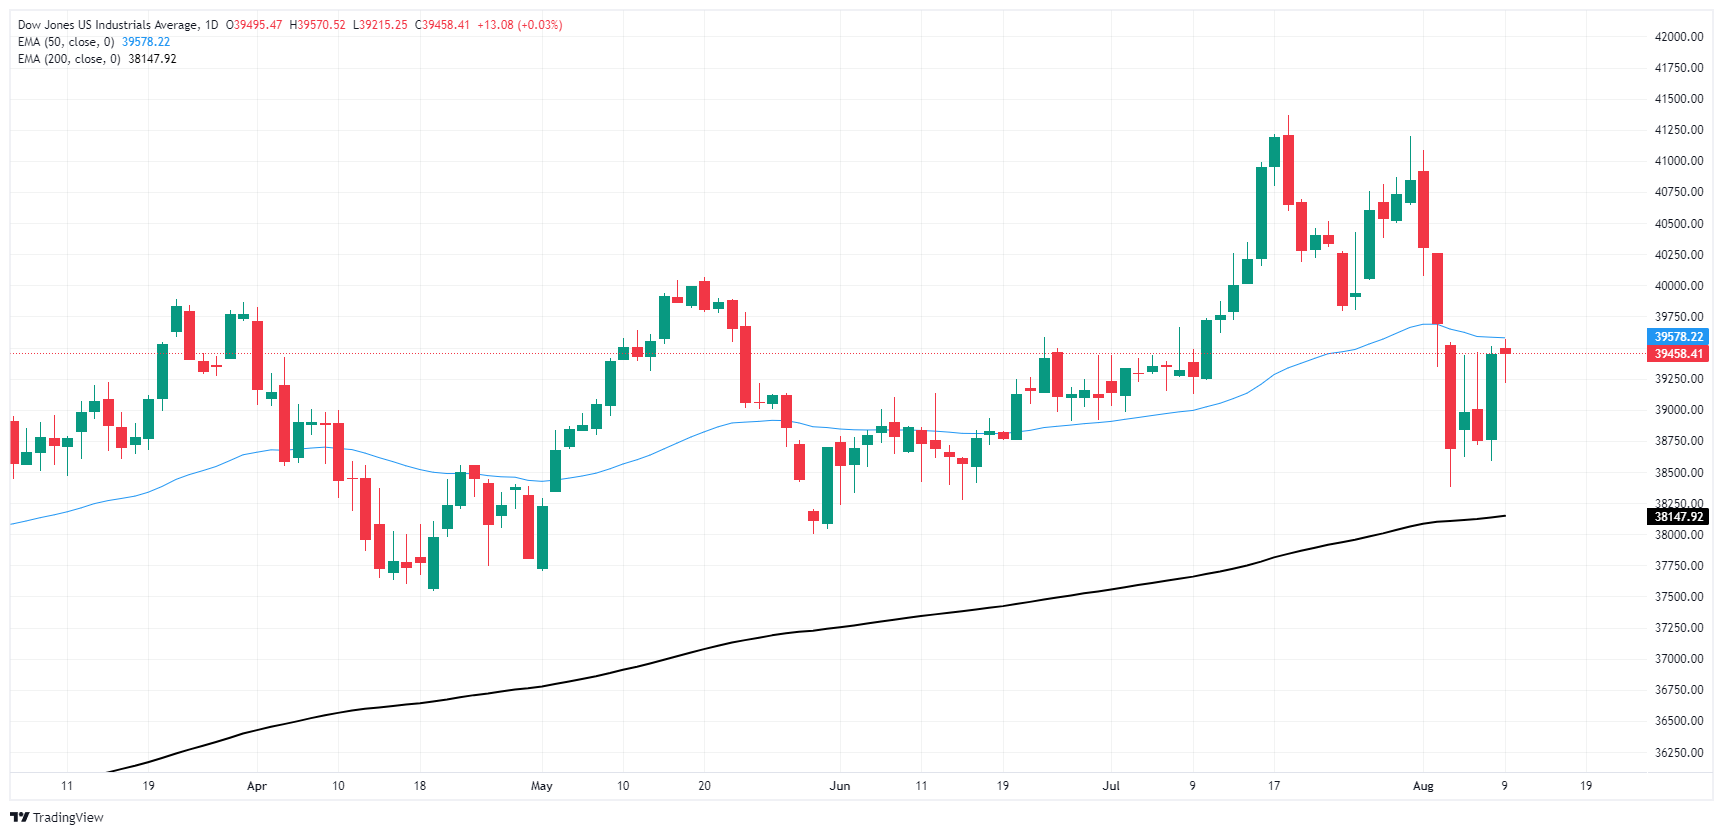
Dow Jones FAQs
The Dow Jones Industrial Average, one of the oldest stock market indices in the world, is compiled of the 30 most traded stocks in the US. The index is price-weighted rather than weighted by capitalization. It is calculated by summing the prices of the constituent stocks and dividing them by a factor, currently 0.152. The index was founded by Charles Dow, who also founded the Wall Street Journal. In later years it has been criticized for not being broadly representative enough because it only tracks 30 conglomerates, unlike broader indices such as the S&P 500.
Many different factors drive the Dow Jones Industrial Average (DJIA). The aggregate performance of the component companies revealed in quarterly company earnings reports is the main one. US and global macroeconomic data also contributes as it impacts on investor sentiment. The level of interest rates, set by the Federal Reserve (Fed), also influences the DJIA as it affects the cost of credit, on which many corporations are heavily reliant. Therefore, inflation can be a major driver as well as other metrics which impact the Fed decisions.
Dow Theory is a method for identifying the primary trend of the stock market developed by Charles Dow. A key step is to compare the direction of the Dow Jones Industrial Average (DJIA) and the Dow Jones Transportation Average (DJTA) and only follow trends where both are moving in the same direction. Volume is a confirmatory criteria. The theory uses elements of peak and trough analysis. Dow’s theory posits three trend phases: accumulation, when smart money starts buying or selling; public participation, when the wider public joins in; and distribution, when the smart money exits.
There are a number of ways to trade the DJIA. One is to use ETFs which allow investors to trade the DJIA as a single security, rather than having to buy shares in all 30 constituent companies. A leading example is the SPDR Dow Jones Industrial Average ETF (DIA). DJIA futures contracts enable traders to speculate on the future value of the index and Options provide the right, but not the obligation, to buy or sell the index at a predetermined price in the future. Mutual funds enable investors to buy a share of a diversified portfolio of DJIA stocks thus providing exposure to the overall index.
Author

Joshua Gibson
FXStreet
Joshua joins the FXStreet team as an Economics and Finance double major from Vancouver Island University with twelve years' experience as an independent trader focusing on technical analysis.


