Dow Jones Industrial Average falls into the red amid rising Middle East tensions
- The Dow Jones fell around 1,000 points from the previous day’s close on Friday.
- Israel launched a surprise round of attacks on Iran late Thursday.
- The attacks, amid an already-tense Middle East, have erased the week’s gains on the Dow.

The Dow Jones Industrial Average (DJIA) fell on Friday, shedding over 1,000 points from the previous day’s close as investors pulled back following Israel’s unexpected wave of strikes on Iran. Consumer sentiment data rebounded more than expected, helping to ease Friday’s downside momentum.
Equity markets, riding the AI-fueled tech rally that has kept them propped up in a post-tariff environment, took the opportunity to de-risk and take a little off the top. This erased the week’s gains and snapped the Dow’s four-day winning streak.
Read more stock news: US stock indices decline after Israeli attack on Iran
The University of Michigan’s (UoM) Consumer Sentiment Index for June rose firmly over the last month, clocking in at 60.5 and handily outrunning the median market forecast of 53.5. UoM 1-year Consumer Inflation Expectations also eased, falling to 5.1% from 6.6%, while 5-year Consumer Inflation Expectations ticked down to 4.1% from 4.2%.
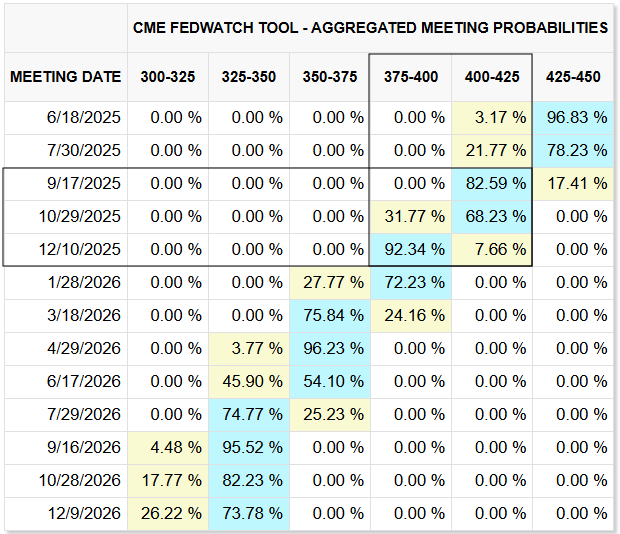
The Federal Reserve’s (Fed) latest rate call is coming up next week. The Fed is broadly expected to remain in wait-and-see mode as the central bank awaits potential fallout from the Trump administration’s whiplash approach to trade policy. Following this week’s better-than-expected inflation prints, rate markets are pricing in around 70% odds of a quarter-point cut in September, with an immediate follow-up rate trim expected in October, but more likely to come in December.
Dow Jones price forecast
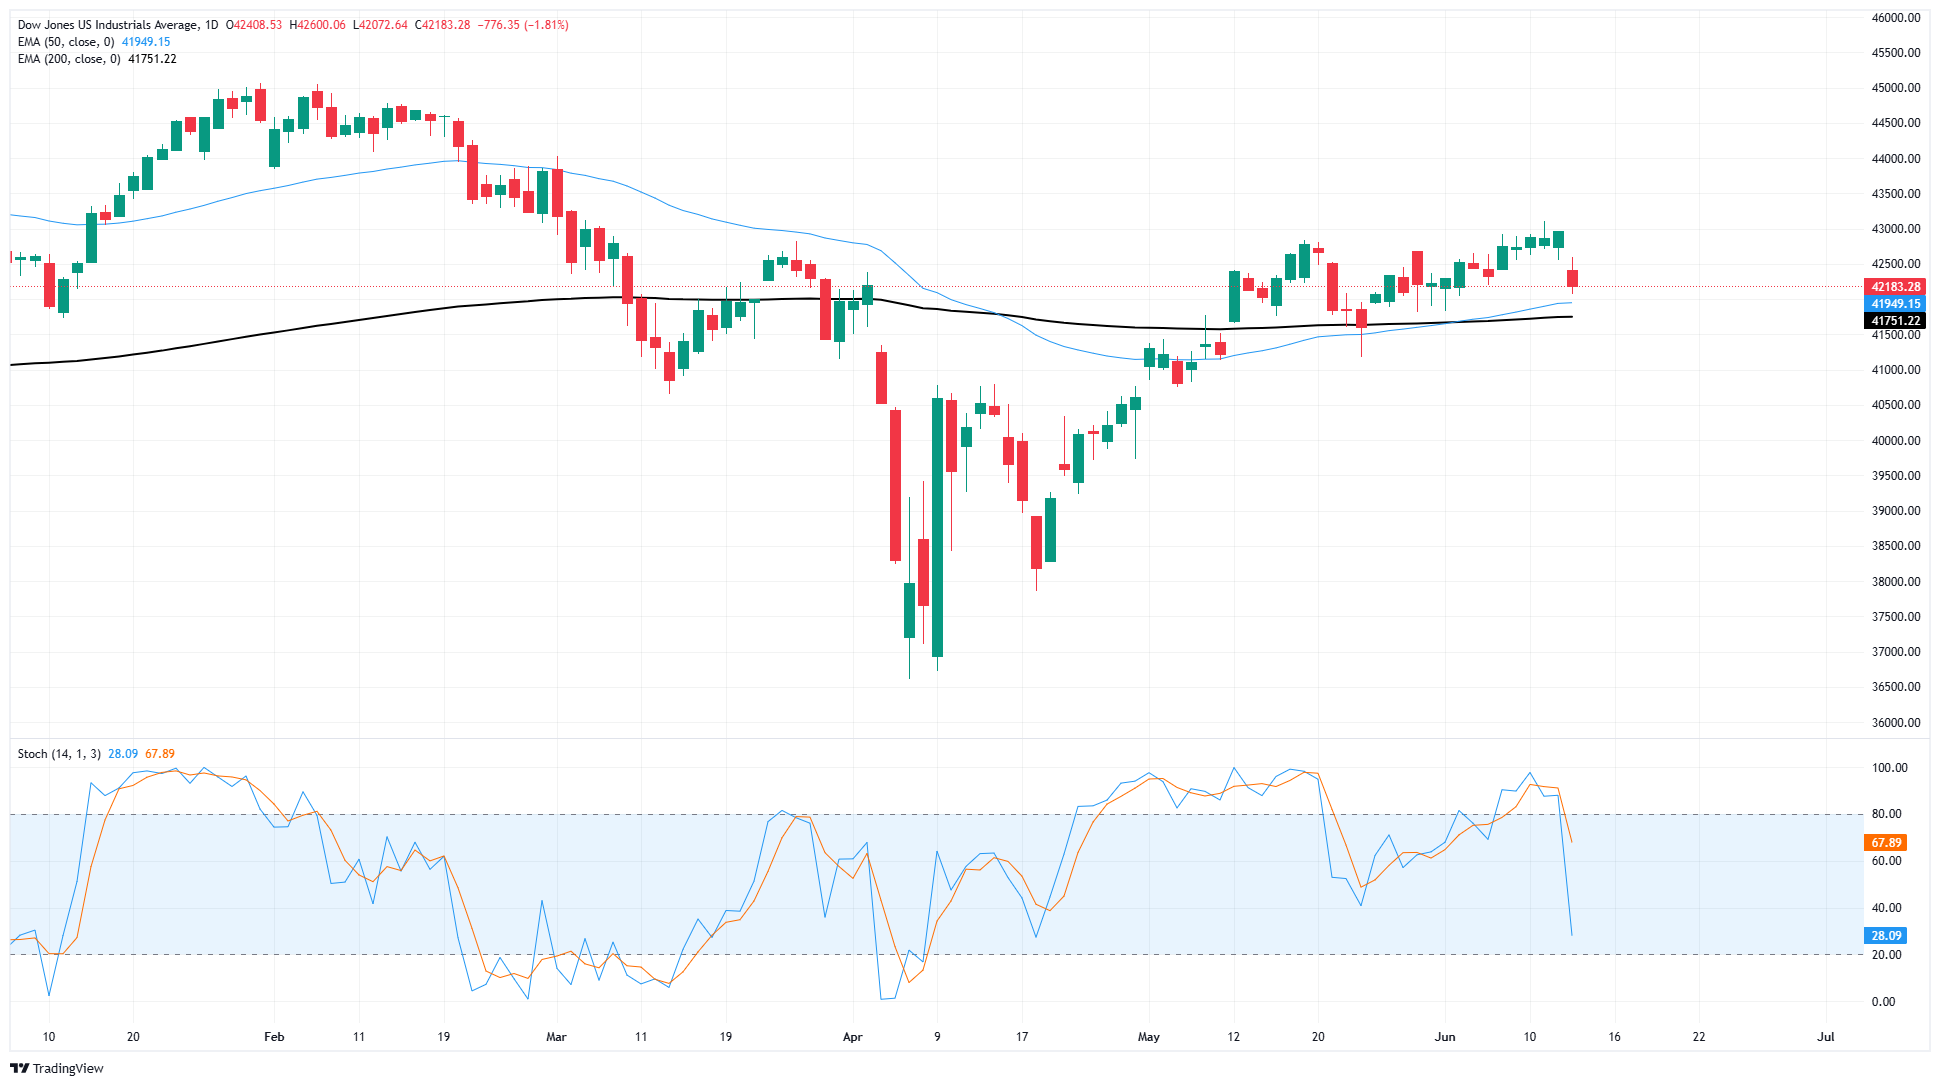
It’s been a tough week for position holders in the Dow Jones Industrial Average. After four straight days of hard-fought gains, the major equity index has tumbled back into a recent consolidation zone, putting bullish momentum on pause.
The Dow is still trading above the 200-day Exponential Moving Average (EMA) near 41,800 despite near-term weakness, and the 50-day EMA is in the process of completing a bullish cross of the long-run moving average, implying a fresh leg higher could be in the works if price action complies with technical support from the 42,000 area.
Dow Jones daily chart
Economic Indicator
Michigan Consumer Sentiment Index
The Michigan Consumer Sentiment Index, released on a monthly basis by the University of Michigan, is a survey gauging sentiment among consumers in the United States. The questions cover three broad areas: personal finances, business conditions and buying conditions. The data shows a picture of whether or not consumers are willing to spend money, a key factor as consumer spending is a major driver of the US economy. The University of Michigan survey has proven to be an accurate indicator of the future course of the US economy. The survey publishes a preliminary, mid-month reading and a final print at the end of the month. Generally, a high reading is bullish for the US Dollar (USD), while a low reading is bearish.
Read more.Last release: Fri Jun 13, 2025 14:00 (Prel)
Frequency: Monthly
Actual: 60.5
Consensus: 53.5
Previous: 52.2
Source: University of Michigan
Consumer exuberance can translate into greater spending and faster economic growth, implying a stronger labor market and a potential pick-up in inflation, helping turn the Fed hawkish. This survey’s popularity among analysts (mentioned more frequently than CB Consumer Confidence) is justified because the data here includes interviews conducted up to a day or two before the official release, making it a timely measure of consumer mood, but foremost because it gauges consumer attitudes on financial and income situations. Actual figures beating consensus tend to be USD bullish.
Author

Joshua Gibson
FXStreet
Joshua joins the FXStreet team as an Economics and Finance double major from Vancouver Island University with twelve years' experience as an independent trader focusing on technical analysis.