Dow Jones Industrial Average falls 380 points on Thursday as AI stocks drop
- The Dow Jones shed weight on Thursday as the AI rally withers further.
- The US government shutdown has officially become the longest in US history.
- Private data sets, in the absence of official data, are pointing to potential problems.

The Dow Jones Industrial Average (DJIA) tumbled 400 points at its lowest on Thursday, falling to its lowest valuation in nearly two weeks as equity indexes were crushed underfoot by a broad pivot out of AI tech stocks. US economic data is restricted to volatile private datasets amid the ongoing federal government closure, causing investors to fret about wonky release figures that have a poor historical correlation to large-scale government data collection and reporting.
Overextended AI stock declines drag down broader market
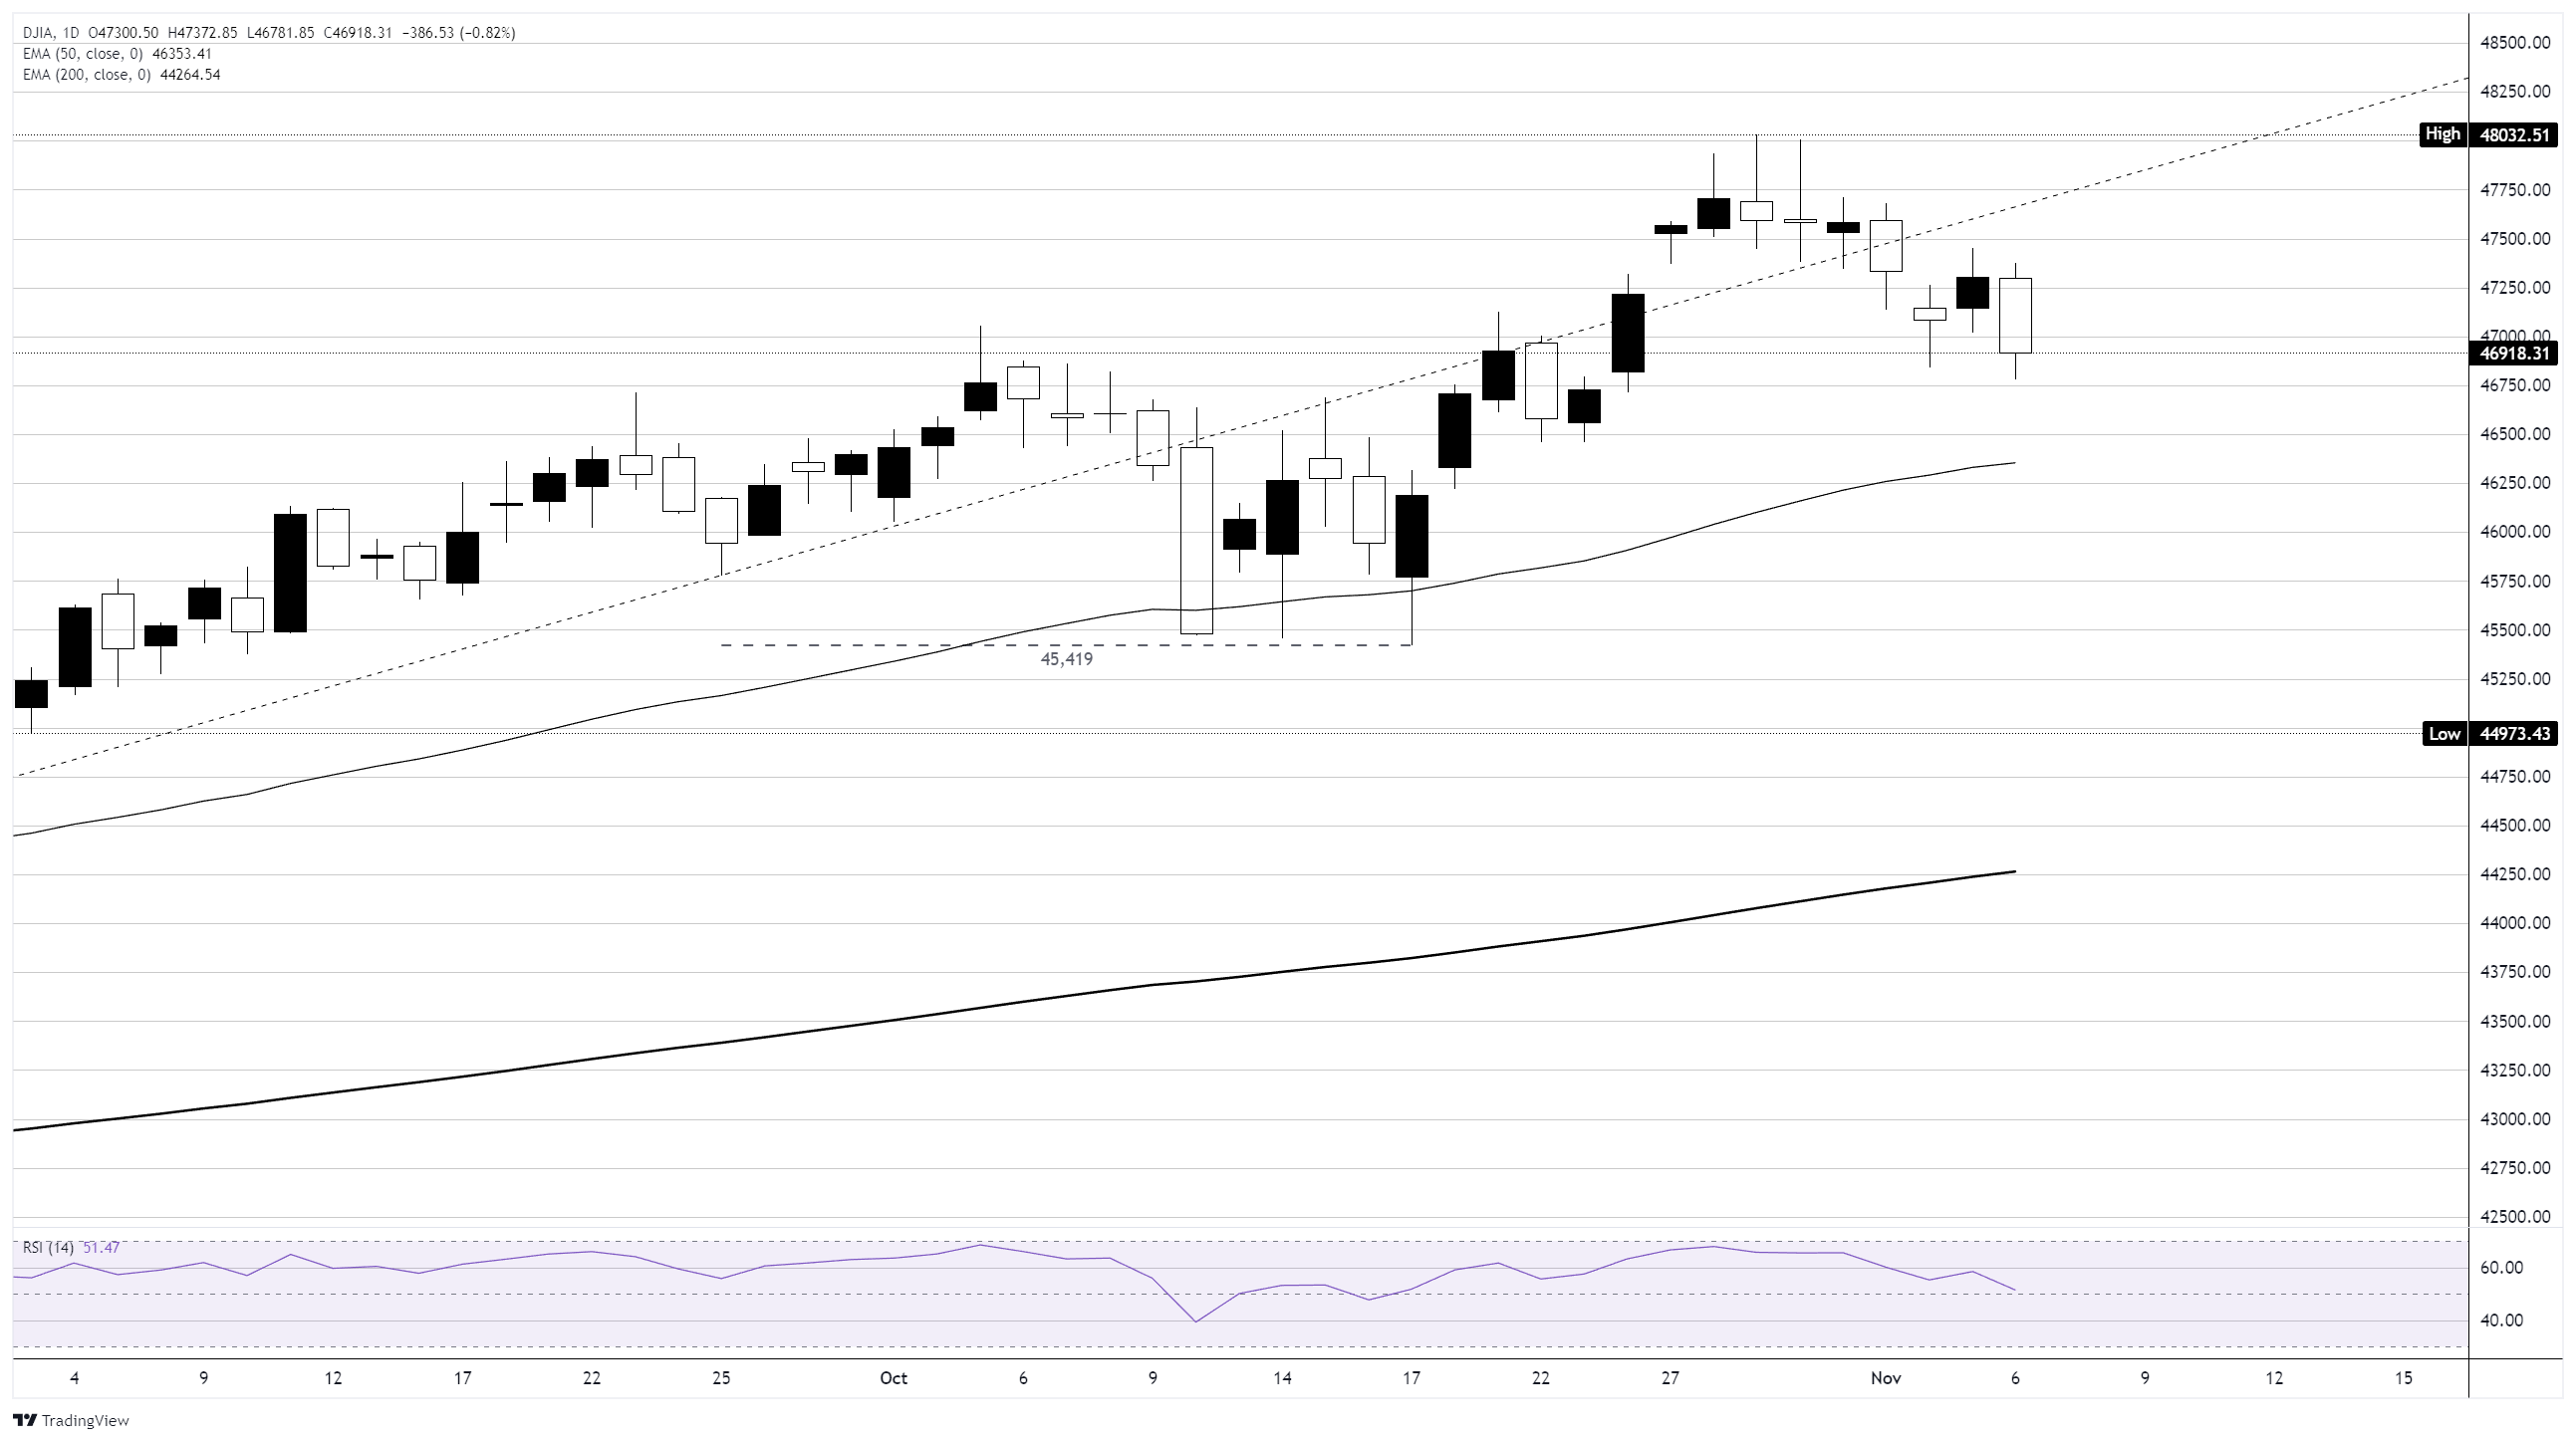
The Dow Jones tested back below the 47,000 handle, down around 2.6% peak-to-trough after posting record highs just above 48,000 at the end of October. A general decline in tech stocks is getting a fresh look on Thursday following an initial selloff and brief recovery through the middle of the week. Salesforce (CRM), Nvidia (NVDA), and Microsoft (MSFT) are all in the red for the day as investors begin to take a closer look at whether sky-high valuations and forward P/E ratios measured in centuries for data center tech suppliers can continue to be justified in the face of still-mythical revenue generation from AI projects.
US job losses accelerate, fraying investor nerves
US Challenger Job Cuts showed a net loss of a little over 153K employment positions in October. This marks the highest Challenger figure reported since April of this year, when the Trump administration formally announced its widespread tariff strategy that would take months and several delays to enact. Excluding the Covid pandemic era, this marks the second-worst Challenger Job Cuts print since data collection and reporting began.
The US government shutdown has officially entered the record books as the longest federal closure in US history, highlighting President Donald Trump’s past statements that the President, regardless of who it is, is singularly responsible for government shutdowns and is solely responsible for ending them as quickly as possible. With the US government on ice, official datasets have gone dark, pushing investors into over-reliance on private data sources that tend to have a tenuous, volatile relationship with smoothed, large-scale official collections from government sources.
Dow Jones daily chart
Dow Jones FAQs
The Dow Jones Industrial Average, one of the oldest stock market indices in the world, is compiled of the 30 most traded stocks in the US. The index is price-weighted rather than weighted by capitalization. It is calculated by summing the prices of the constituent stocks and dividing them by a factor, currently 0.152. The index was founded by Charles Dow, who also founded the Wall Street Journal. In later years it has been criticized for not being broadly representative enough because it only tracks 30 conglomerates, unlike broader indices such as the S&P 500.
Many different factors drive the Dow Jones Industrial Average (DJIA). The aggregate performance of the component companies revealed in quarterly company earnings reports is the main one. US and global macroeconomic data also contributes as it impacts on investor sentiment. The level of interest rates, set by the Federal Reserve (Fed), also influences the DJIA as it affects the cost of credit, on which many corporations are heavily reliant. Therefore, inflation can be a major driver as well as other metrics which impact the Fed decisions.
Dow Theory is a method for identifying the primary trend of the stock market developed by Charles Dow. A key step is to compare the direction of the Dow Jones Industrial Average (DJIA) and the Dow Jones Transportation Average (DJTA) and only follow trends where both are moving in the same direction. Volume is a confirmatory criteria. The theory uses elements of peak and trough analysis. Dow’s theory posits three trend phases: accumulation, when smart money starts buying or selling; public participation, when the wider public joins in; and distribution, when the smart money exits.
There are a number of ways to trade the DJIA. One is to use ETFs which allow investors to trade the DJIA as a single security, rather than having to buy shares in all 30 constituent companies. A leading example is the SPDR Dow Jones Industrial Average ETF (DIA). DJIA futures contracts enable traders to speculate on the future value of the index and Options provide the right, but not the obligation, to buy or sell the index at a predetermined price in the future. Mutual funds enable investors to buy a share of a diversified portfolio of DJIA stocks thus providing exposure to the overall index.
Author

Joshua Gibson
FXStreet
Joshua joins the FXStreet team as an Economics and Finance double major from Vancouver Island University with twelve years' experience as an independent trader focusing on technical analysis.


