Dow Jones Industrial Average finds slim gains on tepid Monday
- The Dow Jones clawed back ground on Monday as thin bullish momentum persists.
- US ISM PMI figures came in firmer than expected for April, bolstering market confidence.
- Investor risk appetite remains tepid overall as the US continues to battle its own trade expectations.

The Dow Jones Industrial Average (DJIA) rose slightlyon Monday, extending the ongoing equity recovery even as investor sentiment continues to churn in the face of constantly changing trade policies from the US administration. The Federal Reserve (Fed) is poised to deliver another rate call this week, and Fed policymakers are broadly expected to maintain their wait-and-see approach. Rate markets have fully priced in another hold on rates this Wednesday.
Trade policy inconsistency remains the single large cloud hanging over equity markets, keeping bullish momentum tepid overall. US Treasury Secretary Scott Bessent noted on Monday that the Trump administration is expecting some form of trade deal from up to 17 trading partners, a far cry from United States (US) President Donald Trump’s previous claims several weeks ago of over 200 countries scrambling to offer trade deals. President Trump’s own claims may have been too lofty a goal to set, as only 195 countries are formally recognized to exist in the world.
US ISM Services Purchasing Managers Index (PMI) figures came in much stronger than expected in April, rising to 51.6 MoM, entirely flouting the forecast dip to 50.6 from the previous 50.8. The firm upside beat helped to bolster key industrial sector stocks. However, upside gains were firmly offset by further declines in the energy and general consumer goods sectors.
Read more stock news: Palantir stock pauses rally ahead of Monday earnings release
Dow Jones price forecast
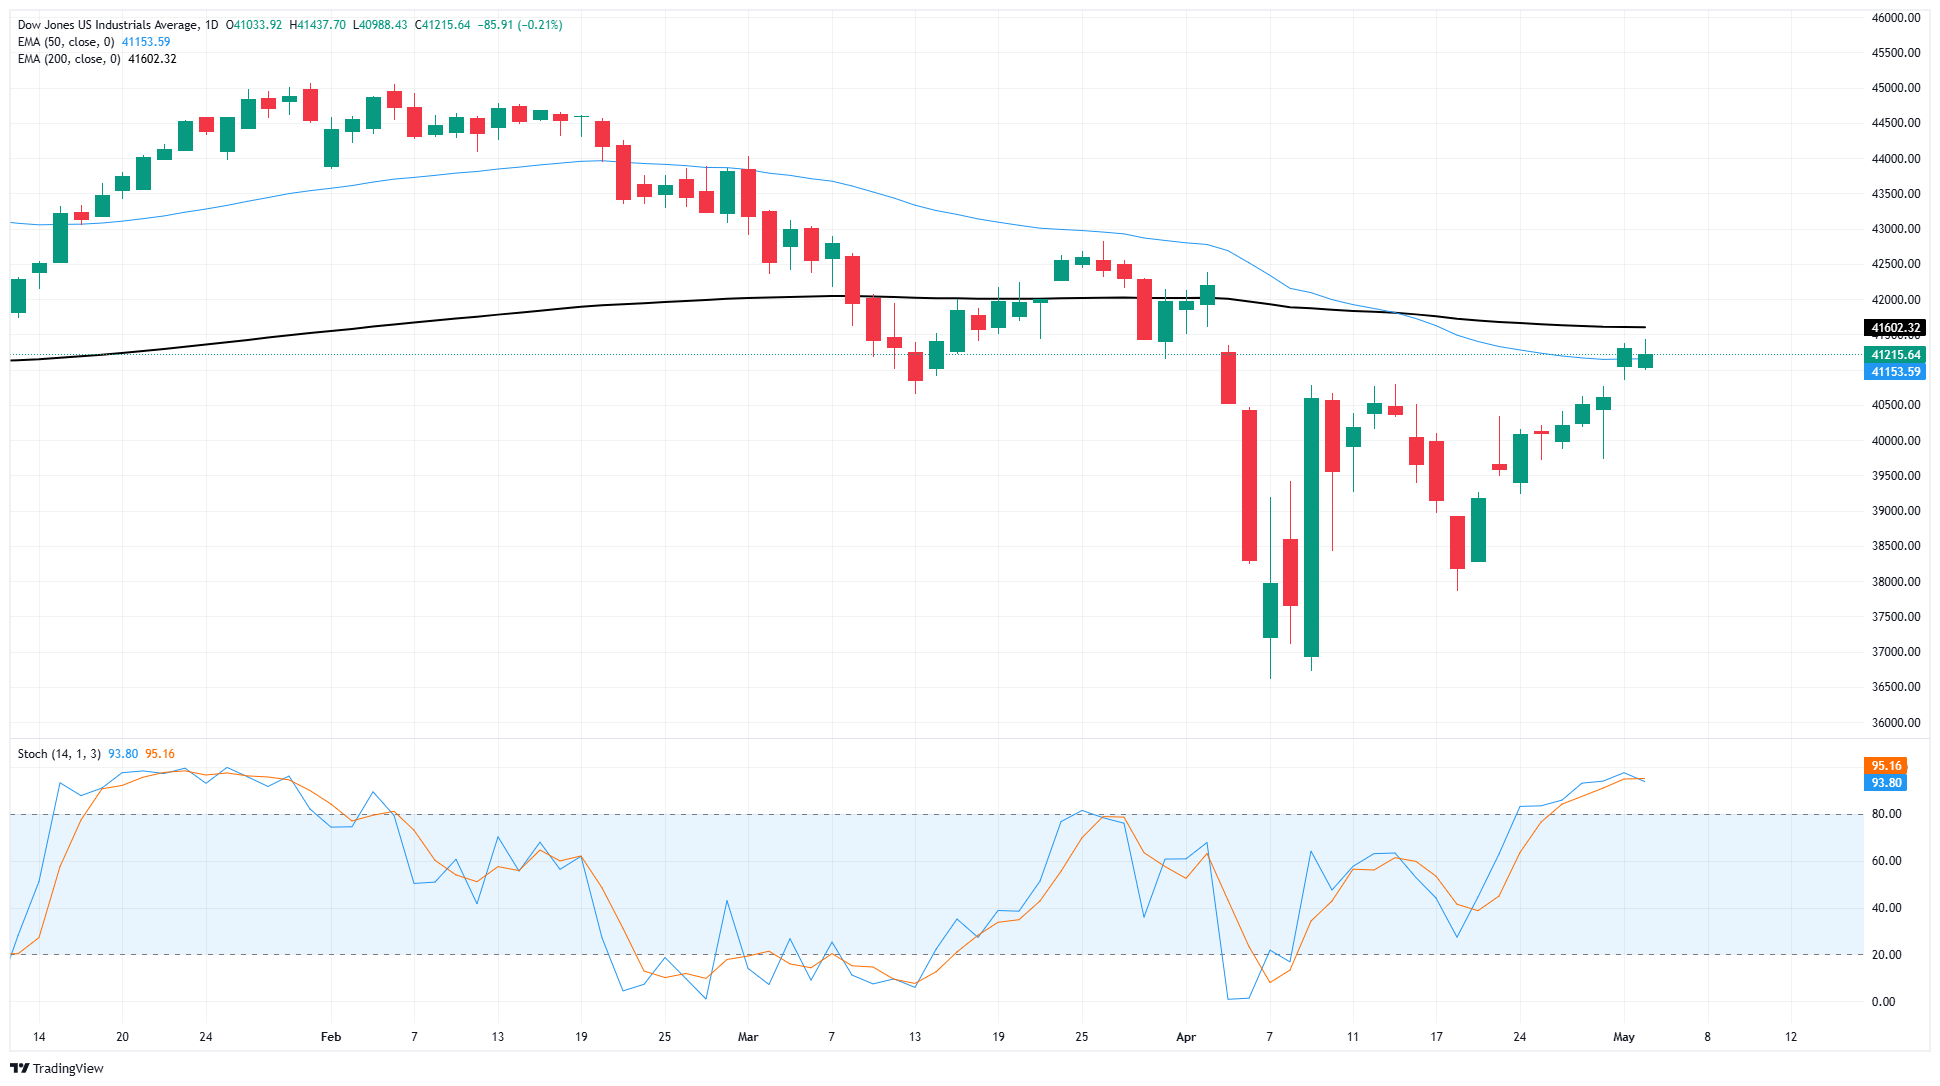
Monday’s cautious yet determined bullish push has inched bids even closer to the 200-day Exponential Moving Average (EMA) near 41,600. The Dow Jones has recovered nearly 9.5% from its April 21 low of 37,853, closing in the green for all but two of the last nine consecutive trading days.
Despite a firm technical recovery, the DJIA remains down over 8% from 2025’s peak bids near 45,070. Lacking any firm technical downside signals, topside momentum remains the default positioning stance, however technical oscillators are beginning to flash warnings of overbought conditions, meaning daily Dow Jones candles could be poised for a breather near key moving averages.
Dow Jones daily chart
Dow Jones FAQs
The Dow Jones Industrial Average, one of the oldest stock market indices in the world, is compiled of the 30 most traded stocks in the US. The index is price-weighted rather than weighted by capitalization. It is calculated by summing the prices of the constituent stocks and dividing them by a factor, currently 0.152. The index was founded by Charles Dow, who also founded the Wall Street Journal. In later years it has been criticized for not being broadly representative enough because it only tracks 30 conglomerates, unlike broader indices such as the S&P 500.
Many different factors drive the Dow Jones Industrial Average (DJIA). The aggregate performance of the component companies revealed in quarterly company earnings reports is the main one. US and global macroeconomic data also contributes as it impacts on investor sentiment. The level of interest rates, set by the Federal Reserve (Fed), also influences the DJIA as it affects the cost of credit, on which many corporations are heavily reliant. Therefore, inflation can be a major driver as well as other metrics which impact the Fed decisions.
Dow Theory is a method for identifying the primary trend of the stock market developed by Charles Dow. A key step is to compare the direction of the Dow Jones Industrial Average (DJIA) and the Dow Jones Transportation Average (DJTA) and only follow trends where both are moving in the same direction. Volume is a confirmatory criteria. The theory uses elements of peak and trough analysis. Dow’s theory posits three trend phases: accumulation, when smart money starts buying or selling; public participation, when the wider public joins in; and distribution, when the smart money exits.
There are a number of ways to trade the DJIA. One is to use ETFs which allow investors to trade the DJIA as a single security, rather than having to buy shares in all 30 constituent companies. A leading example is the SPDR Dow Jones Industrial Average ETF (DIA). DJIA futures contracts enable traders to speculate on the future value of the index and Options provide the right, but not the obligation, to buy or sell the index at a predetermined price in the future. Mutual funds enable investors to buy a share of a diversified portfolio of DJIA stocks thus providing exposure to the overall index.
Author

Joshua Gibson
FXStreet
Joshua joins the FXStreet team as an Economics and Finance double major from Vancouver Island University with twelve years' experience as an independent trader focusing on technical analysis.


