Dow Jones Industrial Average sheds -200 points on Tuesday, dragged down by health sector
- Dow Jones gets dragged down by declines in healthcare and biotech.
- Equities rebalancing after US markets return after holiday.
- Investors on the lookout for signs of rate cuts from cautious Fed.

The Dow Jones Industrial Average (DJIA) shed weight on Tuesday after US markets returned to action following an extended holiday weekend. The Dow Jones drew the short straw of the major US indexes, tumbling over half of a percent as investors pull back on healthcare services and biotech stocks listed on the Dow Jones.
All four of the health-related stocks listed on the Dow Jones were down steeply on Tuesday, dragging the major equity index into the red. The Conference Board’s consumer confidence and inflation outlook both accelerated in May, highlighting the difficulties lying ahead for the Federal Reserve (Fed) to deliver rate cuts as fast and as furious as investors continue to hope for. With economic activity continuing to flaunt broad-market forecasts for a downturn that has yet to materialize, and consumer fears of inflation anchoring realized inflation higher, the Fed’s options for trimming interest rates have been hobbled looking forward.
The CB’s Consumer Confidence Index rose to 102 on Tuesday, up from the revised previous of 97.5, and rising above the forecast 96. CB consumer 12-month inflation expectations also rose to 5.4%, with the share of those expecting higher rates rising to 56.2%.
Investors will be looking ahead to Thursday’s US Annualized Q1 Gross Domestic Product (GDP), which is expected to ease to 1.3% versus the previous 1.6%. Friday’s Core US Personal Consumption Expenditure (PCE) inflation is forecast to hold at 0.3% MoM in April.
Dow Jones news
The Dow Jones was sharply lower compared to its peer US indexes, shedding over 300 points as healthcare stocks send the equity board into its lowest since the beginning of the month. A late-day recovery limited the index's Tuesday losses to around 200 points, but were unable to drag the index back to even on the day. Two-thirds of the DJIA were in the red on Tuesday, with losses being led by three of the four listed health-associated securities.
Merck & Co Inc. (MRK) is down -2.7% at $126.00 per share, closely followed by biotech firm Amgen Inc. (AMGN), which shed -7 points, falling -2.33% and dropping below $300.00 per share for the first time since the start of the month. Johnson & Johnson (JNJ) also fell -1.81% to $144.31 per share.
Dow Jones technical outlook
The Dow Jones Industrial Average fell back below 38,800.00 on Tuesday as the index sheds over 300 points and shows no signs of slowing. The index has tumbled nearly nine-tenths of a percent on the day, and the index is now down 3.5% from record highs just above 40,000.00.
Despite trading deep into bull country above the 200-day Exponential Moving Average (EMA) at 37,220.31, the Dow Jones is poised for further technical downside as the index tumbles through the 50-day EMA at 38,907.10.
Dow Jones five minute chart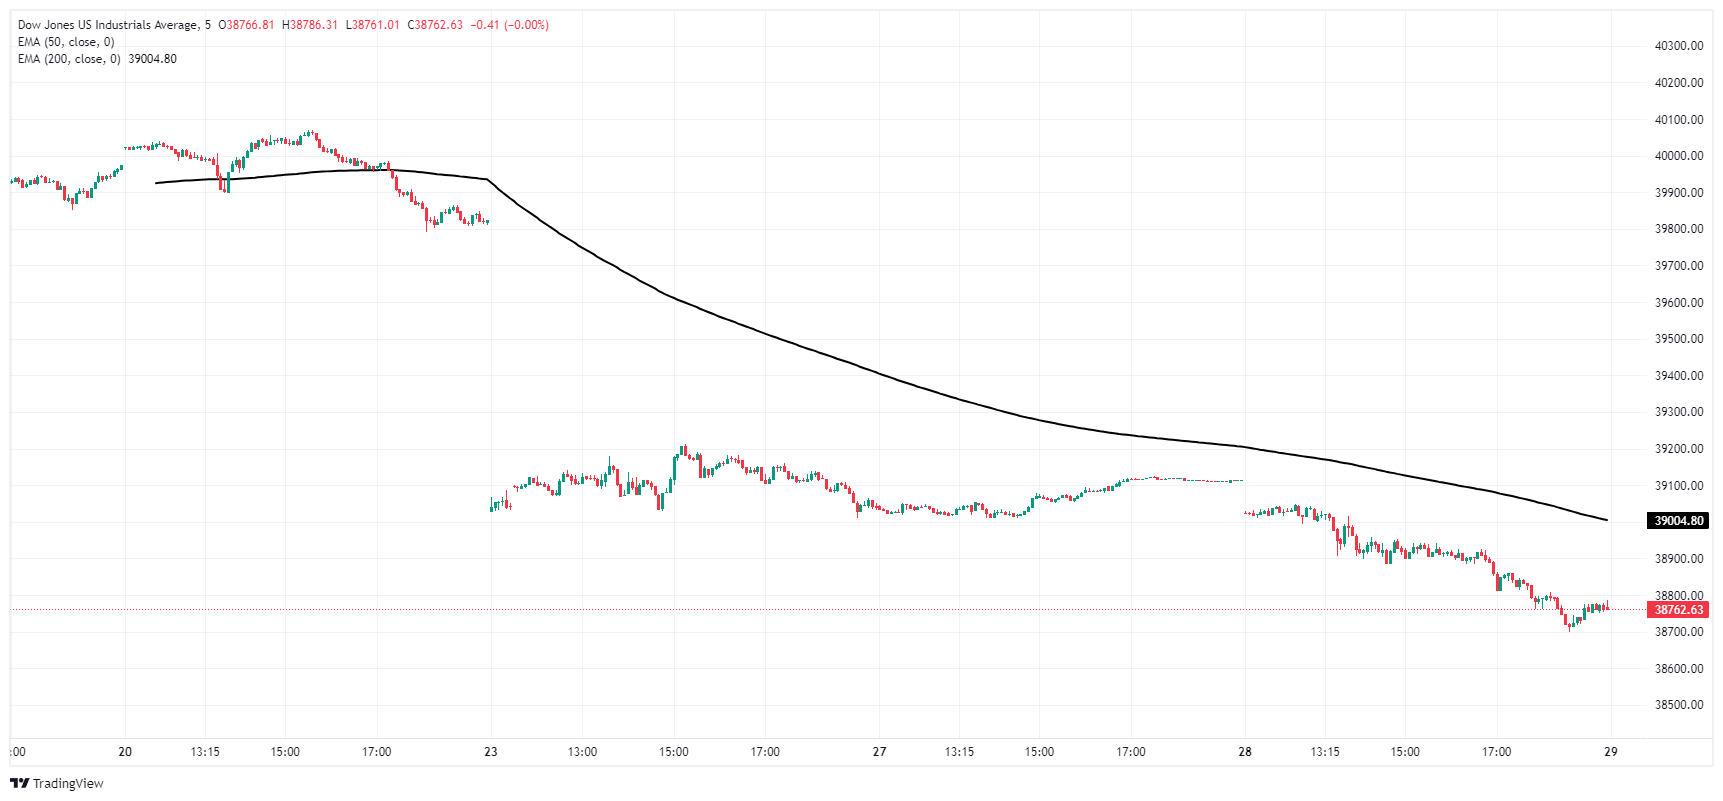
Dow Jones daily chart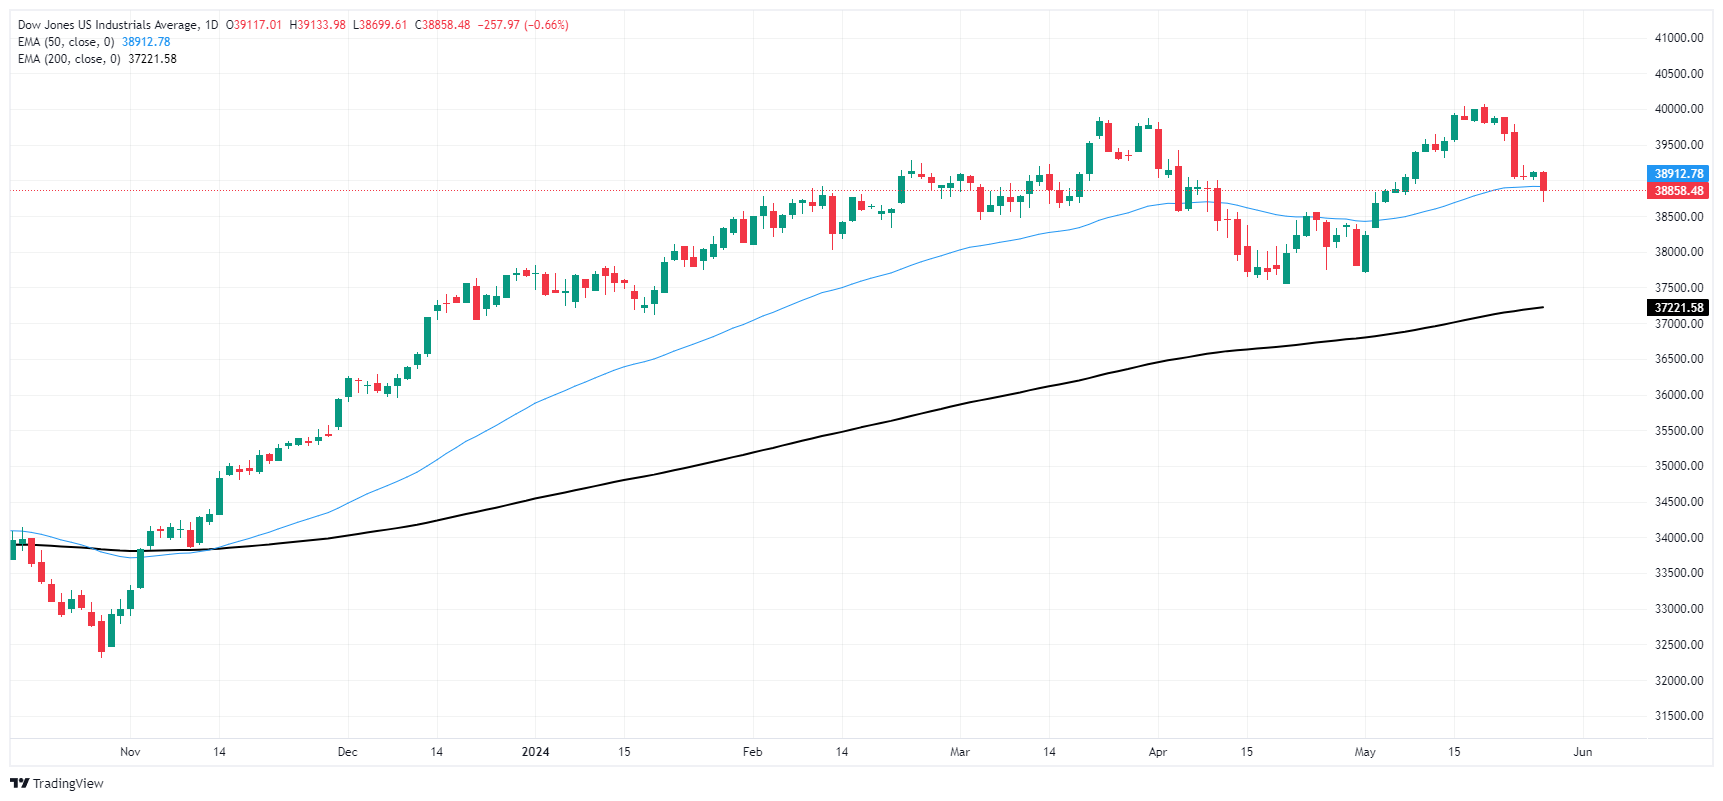
Economic Indicator
Gross Domestic Product Annualized
The real Gross Domestic Product (GDP) Annualized, released quarterly by the US Bureau of Economic Analysis, measures the value of the final goods and services produced in the United States in a given period of time. Changes in GDP are the most popular indicator of the nation’s overall economic health. The data is expressed at an annualized rate, which means that the rate has been adjusted to reflect the amount GDP would have changed over a year’s time, had it continued to grow at that specific rate. Generally speaking, a high reading is seen as bullish for the US Dollar (USD), while a low reading is seen as bearish.
Read more.Next release: Thu May 30, 2024 12:30 (Prel)
Frequency: Quarterly
Consensus: 1.3%
Previous: 1.6%
Source: US Bureau of Economic Analysis
The US Bureau of Economic Analysis (BEA) releases the Gross Domestic Product (GDP) growth on an annualized basis for each quarter. After publishing the first estimate, the BEA revises the data two more times, with the third release representing the final reading. Usually, the first estimate is the main market mover and a positive surprise is seen as a USD-positive development while a disappointing print is likely to weigh on the greenback. Market participants usually dismiss the second and third releases as they are generally not significant enough to meaningfully alter the growth picture.
Author

Joshua Gibson
FXStreet
Joshua joins the FXStreet team as an Economics and Finance double major from Vancouver Island University with twelve years' experience as an independent trader focusing on technical analysis.


