Since reaching its low on April 7, 2025, Dow Futures (YM) has shown signs of recovery. The Index has initiated a rally that requires further development to confirm whether the April 7 low will hold as a significant bottom. To establish this, the Index needs to either achieve a new all-time high or complete a clear five-wave structure from the April 7 low. Either of these developments would significantly reduce the probability of the Index undergoing a larger double correction. Currently, the rally from the April 7 low is in progress and appears to be forming an impulsive structure. An impulse is typically a strong bullish signal in technical analysis.
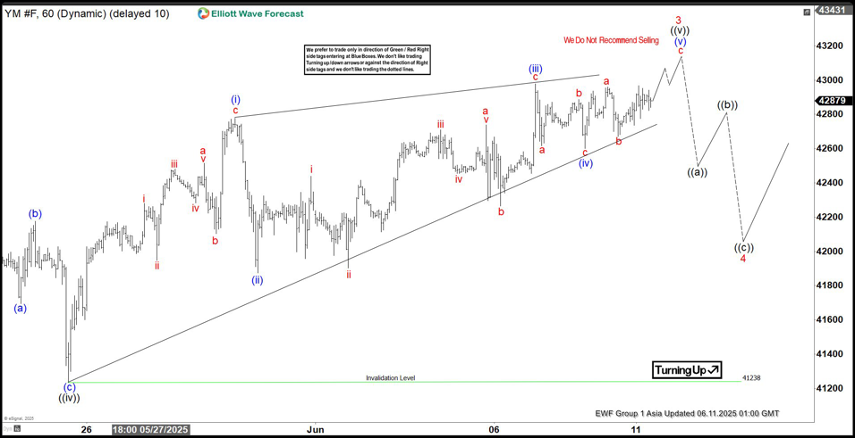
From the April 7 low, the rally has unfolded as follows: wave 1 peaked at 39,427. A corrective wave 2 then followed which ended at 36,882. The ongoing wave 3 is subdividing into a smaller-degree impulse, indicating continued upward momentum. Within wave 3, wave ((i)) concluded at 41,140, and the subsequent pullback in wave ((ii)) ended at 37,998. The advance in wave ((iii)) reached 42,976, with the corrective wave ((iv)) bottoming at 41,236. Currently, wave ((v)) is forming as an ending diagonal, a pattern often signaling the final stage of a move. As long as the Index remains above 41,238, expect one more push higher to complete wave ((v)), which should also finalize wave 3 in the higher degree. Following this, the Index is anticipated to experience a larger-degree wave 4 pullback, likely unfolding in a 3, 7, or 11-swing corrective pattern, before resuming its upward trajectory.
Dow Futures 60-minute Elliott Wave technical chart
Dow Futures Elliott Wave [Video]
FURTHER DISCLOSURES AND DISCLAIMER CONCERNING RISK, RESPONSIBILITY AND LIABILITY Trading in the Foreign Exchange market is a challenging opportunity where above average returns are available for educated and experienced investors who are willing to take above average risk. However, before deciding to participate in Foreign Exchange (FX) trading, you should carefully consider your investment objectives, level of xperience and risk appetite. Do not invest or trade capital you cannot afford to lose. EME PROCESSING AND CONSULTING, LLC, THEIR REPRESENTATIVES, AND ANYONE WORKING FOR OR WITHIN WWW.ELLIOTTWAVE- FORECAST.COM is not responsible for any loss from any form of distributed advice, signal, analysis, or content. Again, we fully DISCLOSE to the Subscriber base that the Service as a whole, the individual Parties, Representatives, or owners shall not be liable to any and all Subscribers for any losses or damages as a result of any action taken by the Subscriber from any trade idea or signal posted on the website(s) distributed through any form of social-media, email, the website, and/or any other electronic, written, verbal, or future form of communication . All analysis, trading signals, trading recommendations, all charts, communicated interpretations of the wave counts, and all content from any media form produced by www.Elliottwave-forecast.com and/or the Representatives are solely the opinions and best efforts of the respective author(s). In general Forex instruments are highly leveraged, and traders can lose some or all of their initial margin funds. All content provided by www.Elliottwave-forecast.com is expressed in good faith and is intended to help Subscribers succeed in the marketplace, but it is never guaranteed. There is no “holy grail” to trading or forecasting the market and we are wrong sometimes like everyone else. Please understand and accept the risk involved when making any trading and/or investment decision. UNDERSTAND that all the content we provide is protected through copyright of EME PROCESSING AND CONSULTING, LLC. It is illegal to disseminate in any form of communication any part or all of our proprietary information without specific authorization. UNDERSTAND that you also agree to not allow persons that are not PAID SUBSCRIBERS to view any of the content not released publicly. IF YOU ARE FOUND TO BE IN VIOLATION OF THESE RESTRICTIONS you or your firm (as the Subscriber) will be charged fully with no discount for one year subscription to our Premium Plus Plan at $1,799.88 for EACH person or firm who received any of our content illegally through the respected intermediary’s (Subscriber in violation of terms) channel(s) of communication.
Recommended content
Editors’ Picks

EUR/USD retreats from multi-year tops past 1.1600
On Thursday, the EUR/USD extended its uptrend and reached its highest level since November 2021, north of 1.1600 the figure. The marked advance in the pair came in response to the pronounced decline in the US Dollar, aggravated after poor results from the US labour market and softer producer prices.

GBP/USD keeps the bid bias intact around 1.3600
Following an initial dip to the 1.3520 zone, the GBP/USD regained traction and traded over the 1.3600 mark on Thursday, building on Wednesday’s gains. The US Dollar (USD) is under heavy selling pressure following weaker inflation data and disappointing jobless claims number.

Gold remains strong around $3,400
Gold maintains its weekly rebound well in place, now trading near the $3,400 mark per troy ounce following a strong retracement in the US Dollar, declining US yields across the curve and growing geopolitical tensions.

Cardano Price Forecast: Whales acquire 310 million ADA amid potential triangle breakout
Cardano (ADA) shows weakness as it reverses from an overhead trendline of a triangle pattern. The altcoin edges lower by over 1% at press time on Thursday, fueling a steeper correction in its Open Interest. Amid weakness, Cardano whales have acquired 310 million ADA tokens so far this month, projecting increased confidence as the triangle pattern nears resolution.

US tariffs here to stay, trade deals ‘largely symbolic’
Despite legal challenges to IEEPA tariffs, US trade policy remains firm. Tariffs on steel and aluminium have doubled, and new sectoral tariffs are expected. Trade deals may emerge, but most will be symbolic. Effective tariff rates will stay high throughout 2025.