|

Dollar Index technical analysis: Double bottom breakout

  • Dollar Index's daily chart is reporting a double bottom breakout. 
  • The pattern has created a room for a rally to 98.86.

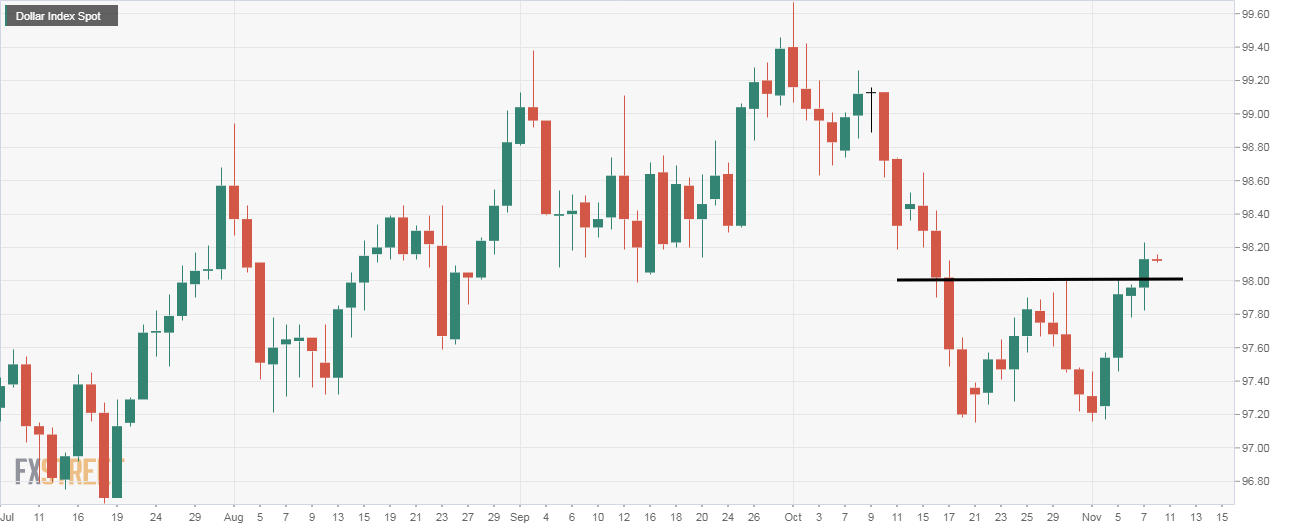
Dollar Index, which tracks the value of the greenback against majors, closed 0.18% higher on the day at 98.13, confirming a double bottom breakout on the daily chart

The pattern indicates the sell-off from the Oct. 1 high of 99.67 has ended and the bulls have regained control. The breakout has opened doors for 98.86 (target as per the measured move method).

Treasury yields are rising and could continue to boost demand for the US Dollar. The US 10-year yield rose to 1.97% on Thursday to clock the highest level in over three months. 

The bullish case would be invalidated if the index finds acceptance below the former resistance-turned-support of the double top neckline at 98.00.

Currently, the Dollar Index is trading at 98.12.

Daily chart

Trend: Bullish

Technical levels

Dollar Index Spot

Overview
Today last price98.12
Today Daily Change-0.01
Today Daily Change %-0.01
Today daily open98.13
 
Trends
Daily SMA2097.73
Daily SMA5098.33
Daily SMA10097.9
Daily SMA20097.51
 
Levels
Previous Daily High98.23
Previous Daily Low97.82
Previous Weekly High98
Previous Weekly Low97.16
Previous Monthly High99.67
Previous Monthly Low97.15
Daily Fibonacci 38.2%98.07
Daily Fibonacci 61.8%97.98
Daily Pivot Point S197.89
Daily Pivot Point S297.65
Daily Pivot Point S397.48
Daily Pivot Point R198.3
Daily Pivot Point R298.47
Daily Pivot Point R398.71

Author

Omkar Godbole

Omkar Godbole

FXStreet Contributor

Omkar Godbole, editor and analyst, joined FXStreet after four years as a research analyst at several Indian brokerage companies.

More from Omkar Godbole
Share:

Editor's Picks

GBP/USD appears well offered near 1.3160

GBP/USD builds on Tuesday’s losses, although it now manages to pick up some pace and bounce off earlier multi-month troughs near 1.3140. The Greenback’s solid performance and continued political turmoil in the UK are keeping Cable under persistent pressure, with little sign of a meaningful recovery.

EUR/USD trims losses, hovers around 1.1350

EUR/USD now regains some composure and rebounds to the 1.1350 zone on Wednesday, partially reversing the prior pullback to fresh yearly lows near 1.1320. Meanwhile, spot remains on the back foot as the US Dollar continues to draw support from hawkish Fed expectations and uncertainty over the outcome of US-Iran peace negotiations.

Gold pressured near fresh 2026 lows

Gold accelerates its decline and gyrates around the key $4,000 mark per troy ounce on Wednesday, its lowest level since November 2025. In the meantime, tighter-for-longer Fed expectations and a broadly firmer US Dollar continue to weigh on the yellow metal, while uncertainty surrounding a potential US-Iran peace agreement has done little to revive demand for the safe haven space.

Crypto Today: Bitcoin, Ethereum, XRP trade under pressure as September Fed rate-hike odds increase

Bitcoin is trading between $62,000 and $63,000 at the time of writing on Wednesday, weighed down by headwinds stemming from macroeconomic uncertainty and geopolitical tensions in the Middle East.

US-Iran talks: The next 60 days will decide where Oil prices go next
Oil markets received some encouraging news after weeks of rising tensions in the Middle East. But let’s not get ahead of ourselves: we’re far from victory, and markets just seem to have priced out the worst-case scenario. The US and Iran have reportedly made "substantive progress" in talks in Switzerland and agreed on a framework for working toward a broader deal within 60 days.
Regime change: Inside Kevin Warsh's first move to make the Fed unreadable on purpose

The rate did not move. That was the least interesting thing about Kevin Warsh's first meeting in charge of the Fed. The FOMC held its benchmark at 3.50%-3.75% for the fourth straight meeting, exactly as priced, and then the new chair used his first press conference to dismantle the machinery the market has leaned on for a decade.