|

CSX Corp. (CSX) Elliott Wave technical analysis [Video]

CSX Elliott Wave technical analysis

  • Function: Trend.

  • Mode: Impulsive.

  • Structure: Motive.

  • Position: Wave 3 of (1).

  • Direction: Upside in Wave 3.

  • Details: A significant bottom appears to have formed at the April lows. Price action is now moving upward in an impulsive manner, diminishing the likelihood of previous bearish scenarios.

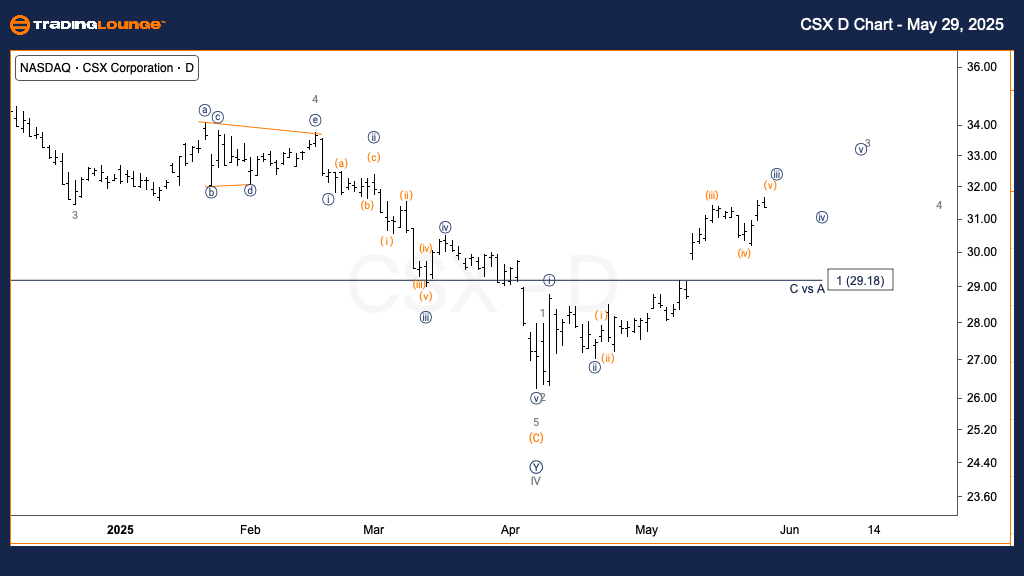
Daily chart analysis

The Elliott Wave assessment of CSX Corporation indicates a potential major reversal with the April lows marking the recent bottom. The upward movement is progressing in a clear impulsive wave, now likely part of Wave 3. This suggests strong bullish momentum is present, reinforcing the uptrend and increasing the likelihood of further gains.

Chart

CSX Elliott Wave technical analysis

  • Function: Trend.

  • Mode: Impulsive.

  • Structure: Motive.

  • Position: Wave (v) of {iii}.

  • Direction: Upside in Wave (v).

  • Details: The stock is approaching a possible top in Wave (v). A short-term pullback into Wave {iv} is expected before another upward move resumes, potentially targeting the $50 level.

One-hour chart analysis

Short-term Elliott Wave analysis shows CSX nearing the completion of Wave (v) of Minute Wave {iii}. This suggests a likely pullback into Wave {iv}, which is part of the ongoing bullish sequence. After this correction, the next upward movement could aim for the $50 region, aligning with broader bullish expectations.

CSX Corp. (CSX) Elliott Wave technical analysis [Video]

Author

Peter Mathers

Peter Mathers

TradingLounge

Peter Mathers started actively trading in 1982. He began his career at Hoei and Shoin, a Japanese futures trading company.

More from Peter Mathers
Share:

Markets move fast. We move first.

Orange Juice Newsletter brings you expert driven insights - not headlines. Every day on your inbox.

By subscribing you agree to our Terms and conditions.

Editor's Picks

EUR/USD moves sideways below 1.1800 on Christmas Eve

EUR/USD struggles to find direction and trades in a narrow channel below 1.1800 after posting gains for two consecutive days. Bond and stock markets in the US will open at the usual time and close early on Christmas Eve, allowing the trading action to remain subdued. 

GBP/USD keeps range around 1.3500 amid quiet markets

GBP/USD keeps its range trade intact at around 1.3500 on Wednesday. The Pound Sterling holds the upper hand over the US Dollar amid pre-Christmas light trading as traders move to the sidelines heading into the holiday season. 

Gold retreats from record highs, trades below $4,500

Gold retreats after setting a new record-high above $4,520 earlier in the day and trades in a tight range below $4,500 as trading volumes thin out ahead of the Christmas break. The US Dollar selling bias remains unabated on the back of dovish Fed expectations, which continues to act as a tailwind for the bullion amid persistent geopolitical risks.

Bitcoin slips below $87,000 as ETF outflows intensify, whale participation declines

Bitcoin price continues to trade around $86,770 on Wednesday, after failing to break above the $90,000 resistance. US-listed spot ETFs record an outflow of $188.64 million on Tuesday, marking the fourth consecutive day of withdrawals.

Economic outlook 2026-2027 in advanced countries: Solidity test

After a year marked by global economic resilience and ending on a note of optimism, 2026 looks promising and could be a year of solid economic performance. In our baseline scenario, we expect most of the supportive factors at work in 2025 to continue to play a role in 2026.

Avalanche struggles near $12 as Grayscale files updated form for ETF

Avalanche trades close to $12 by press time on Wednesday, extending the nearly 2% drop from the previous day. Grayscale filed an updated form to convert its Avalanche-focused Trust into an ETF with the US Securities and Exchange Commission.