CSL Limited Elliott Wave technical forecast [Video]
![CSL Limited Elliott Wave technical forecast [Video]](https://editorial.fxstreet.com/images/TechnicalAnalysis/ChartPatterns/Candlesticks/high-resolution-stock-exchange-evolution-panel-55741904_XtraLarge.jpg)
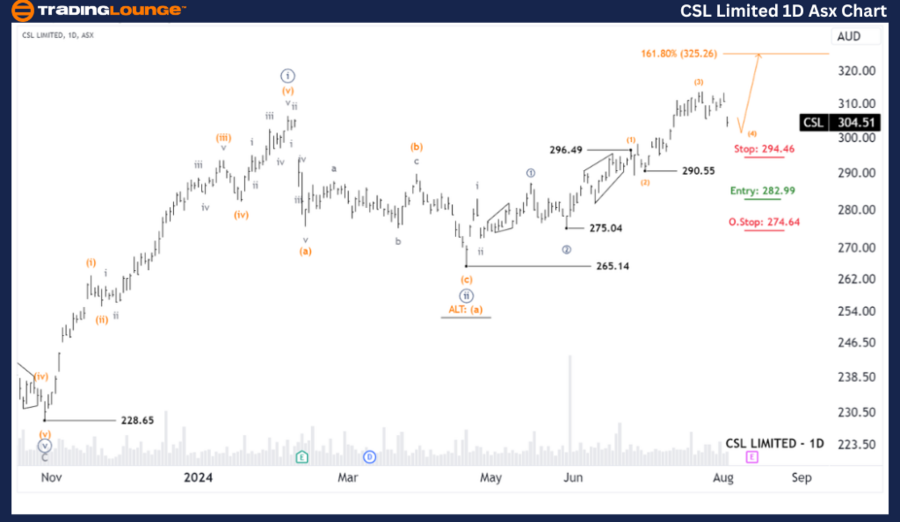
Our Elliott Wave analysis today updates the Australian Stock Exchange (ASX) with CSL LIMITED – CSL. We see that CSL may be moving higher with wave ((iii)) - navy.
ASX: CSL Elliott Wave technical analysis
-
Function: Major trend (Minute degree, navy).
-
Mode: Motive.
-
Structure: Impulse.
-
Position: Wave (4) - orange of Wave ((3)) - navy of Wave iii - grey of Wave ((iii)) - navy.
Details:
-
Wave (4) - orange is opening to push a little lower, then wave (5) - orange could return to push higher.
-
Long Trade position is still making good profit.
-
Invalidation point: 296.49.
CSL one-day chart
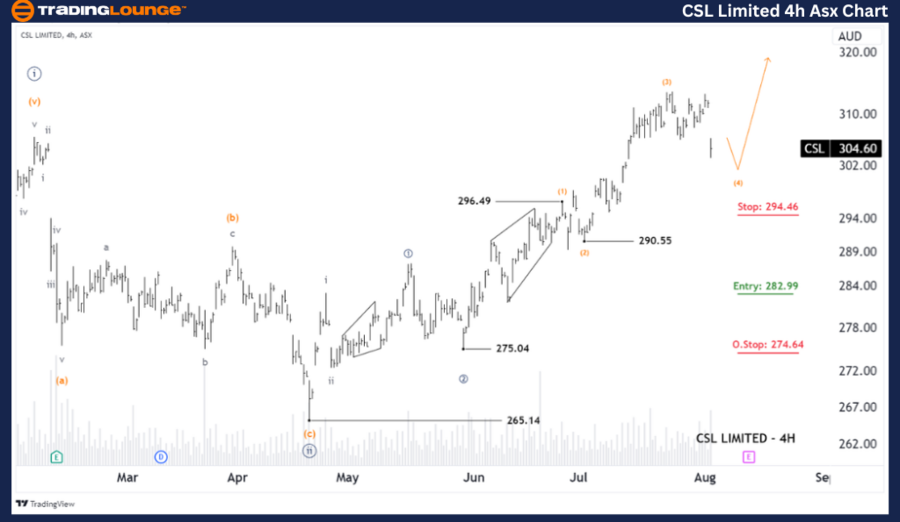
ASX: CSL four-hour chart analysis
-
Function: Major trend (Minuette degree, orange).
-
Mode: Motive.
-
Structure: Impulse.
-
Position: Wave (4) - orange of Wave ((3)) - navy of Wave iii - gray of Wave ((iii)) - navy.
Details:
-
Wave (4) - orange opened as an Expanded Flat and is pushing a little lower, but the price must stay above 296.49. Then wave (5) - orange can return to push higher.
-
Long Trade position is still making good profit.
-
Invalidation point: 296.49.
Conclusion
Our analysis, forecast of contextual trends, and short-term outlook for ASX: CSL LIMITED – CSL aim to provide readers with insights into the current market trends and how to capitalize on them effectively. We offer specific price points that act as validation or invalidation signals for our wave count, enhancing the confidence in our perspective. By combining these factors, we strive to offer readers the most objective and professional perspective on market trends.
CSL Limited Elliott Wave technical forecast [Video]
Author

Peter Mathers
TradingLounge
Peter Mathers started actively trading in 1982. He began his career at Hoei and Shoin, a Japanese futures trading company.


