CSL Limited Elliott Wave technical forecast [Video]
![CSL Limited Elliott Wave technical forecast [Video]](https://editorial.fxstreet.com/images/Markets/Equities/Industries/Semiconductors/pic-man-repairing-semiconductors-637435354060707899_XtraLarge.jpg)
ASX: CSL Elliott Wave technical analysis
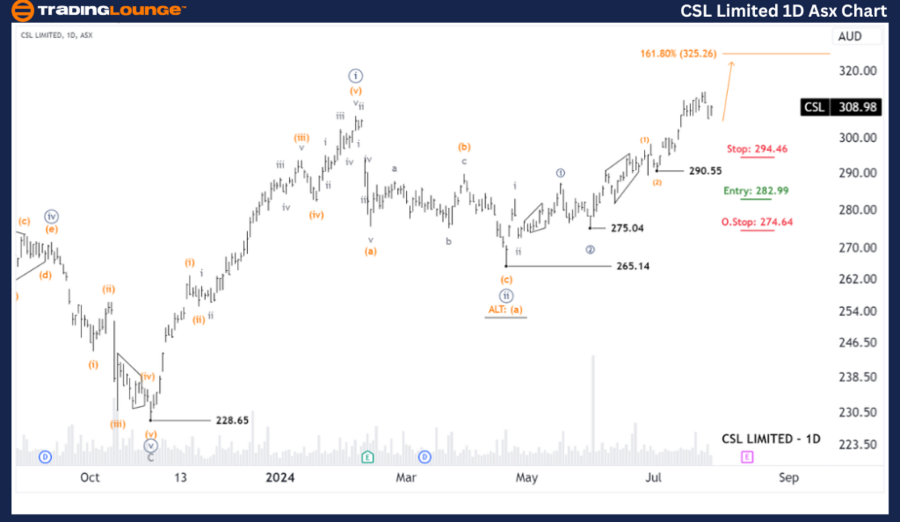
Greetings, our Elliott Wave analysis today provides an update on the Australian Stock Exchange (ASX) featuring CSL LIMITED – CSL. According to our analysis, CSL may be advancing with wave ((iii)) - navy.
ASX: CSL Elliott Wave technical analysis one-day chart (Semilog Scale) analysis
-
Function: Major trend (Minute degree, navy).
-
Mode: Motive.
-
Structure: Impulse.
-
Position: Wave (3) - orange of Wave ((3)) - navy of Wave iii - gray of Wave ((iii)) - navy.
Details: Wave (3) - orange continues its upward momentum, targeting the 325.26 level. The price must stay above 294.81 to maintain this outlook.
Invalidation point: 294.81
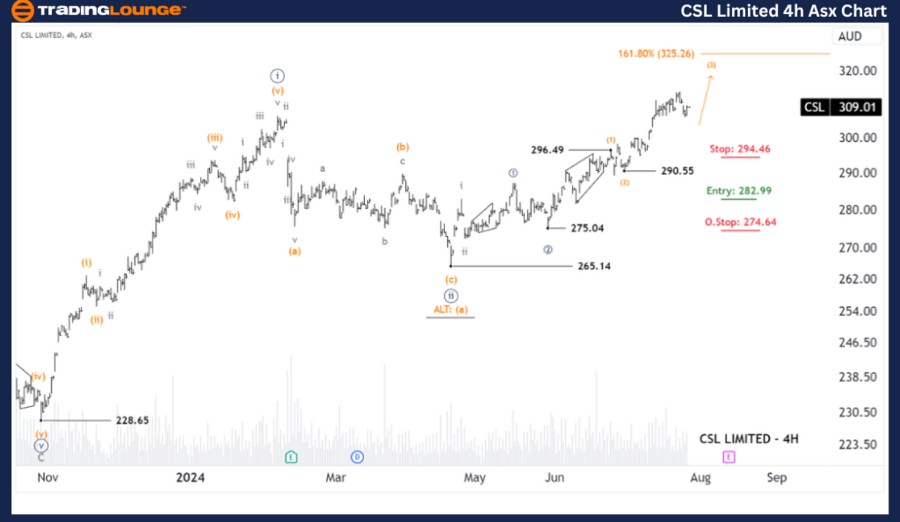
ASX: CSL Elliott Wave technical analysis four-hour chart analysis
-
Function: Major trend (Minuette degree, orange).
-
Mode: Motive.
-
Structure: Impulse.
-
Position: Wave (4) - orange of Wave ((3)) - navy of Wave iii - gray of Wave ((iii)) - navy.
Details: Wave (3) - orange is still expanding upwards, with a potential target of 325.26. The price should remain above 296.49 to sustain this analysis. The Long Trade position with CSL has yielded a good net profit and is expected to continue growing.
Invalidation point: 296.49
Conclusion: Our analysis, forecasting contextual trends, and short-term outlook for ASX: CSL LIMITED – CSL are designed to offer insights into current market trends and effective strategies for capitalizing on them. We provide specific price points as validation or invalidation signals for our wave count, which enhances the reliability of our perspective. By integrating these elements, we aim to deliver the most objective and professional view on market trends.
CSL Limited Elliott Wave technical forecast [Video]
Author

Peter Mathers
TradingLounge
Peter Mathers started actively trading in 1982. He began his career at Hoei and Shoin, a Japanese futures trading company.


