Crude Oil are sprinting higher with key US inventory data on deck
- Oil prices are up over 1.00% this Friday ahead of last Oil data points for 2024.
- Key US Oil data will be released Friday, with expectations for another draw down.
- The US Dollar Index trades flat and resides just above 108.00, heading into New Years Eve next week.

Crude Oil prices are speeding higher on Friday in the US trading session, with markets bracing for a batch of data releases in the US trading session, including stockpile data from the Energy Information Administration (EIA), which was moved due to the Christmas Day holiday on Wednesday. While other asset classes are seeing low volatility, it looks like Oil prices are set to see some last spikes before the week ends.
The US Dollar Index (DXY) – which measures the performance of the US Dollar (USD) against a basket of currencies – remains residing just below the two-year high at around 108.00. The Greenback has seen volatility die down and is not expected to pick up much towards New Year’s Eve. With its current position, a fresh two-year high could still be hit before the end of the year in case an outside event takes place.
At the time of writing, Crude Oil (WTI) trades at $70.40 and Brent Crude at $73.70.
Oil news and market movers: Expectations are high
- At 15:30 GMT, the Energy Information Administration (EIA) will release its weekly Gas Storage Change number. The previous week's storages stood at 125 billion cubic meters.
- At 17:00 GMT, the EIA will release the Crude Oil stockpile change numbers. The expectation is for a drawdown of 2 million barrels against the previous drawdown of 0.934 million barrels.
- On Tuesday, the weekly US American Petroleum Institute (API) stockpile data showed a draw of 3.2 million barrels, lower than the 4.7 million decline seen a week earlier.
- At 18:00 GMT, the Baker Hughes Oil Rig Count will close off this Friday. No forecast is available, with the previous reading at 483 rigs operational.
Oil Technical Analysis: Life span rally limited
Crude Oil price action could be an outlier on Friday as other assets are fully into the Christmas market lull. With still some key data points to digest, Oil traders will need to be on point because there will be a very limited window of opportunity to trade. Expect to see some brief volatile moves, although any possible rally will lack fundamentals to extend into 2025.
Looking up, the 100-day Simple Moving Average (SMA) at $70.59 and $71.46 (February 5 low) act as firm resistance levels nearby. Should more tailwinds emerge in support for Oil, the next pivotal level will be $75.27 (January 12 high). However, watch out for quick profit-taking as the year-end quickly approaches.
On the downside, $67.12 – a level that held the price in May and June 2023 and during the last quarter of 2024 – is still the first solid support nearby. In case that breaks, the 2024 year-to-date low emerges at $64.75, followed by $64.38, the low from 2023.
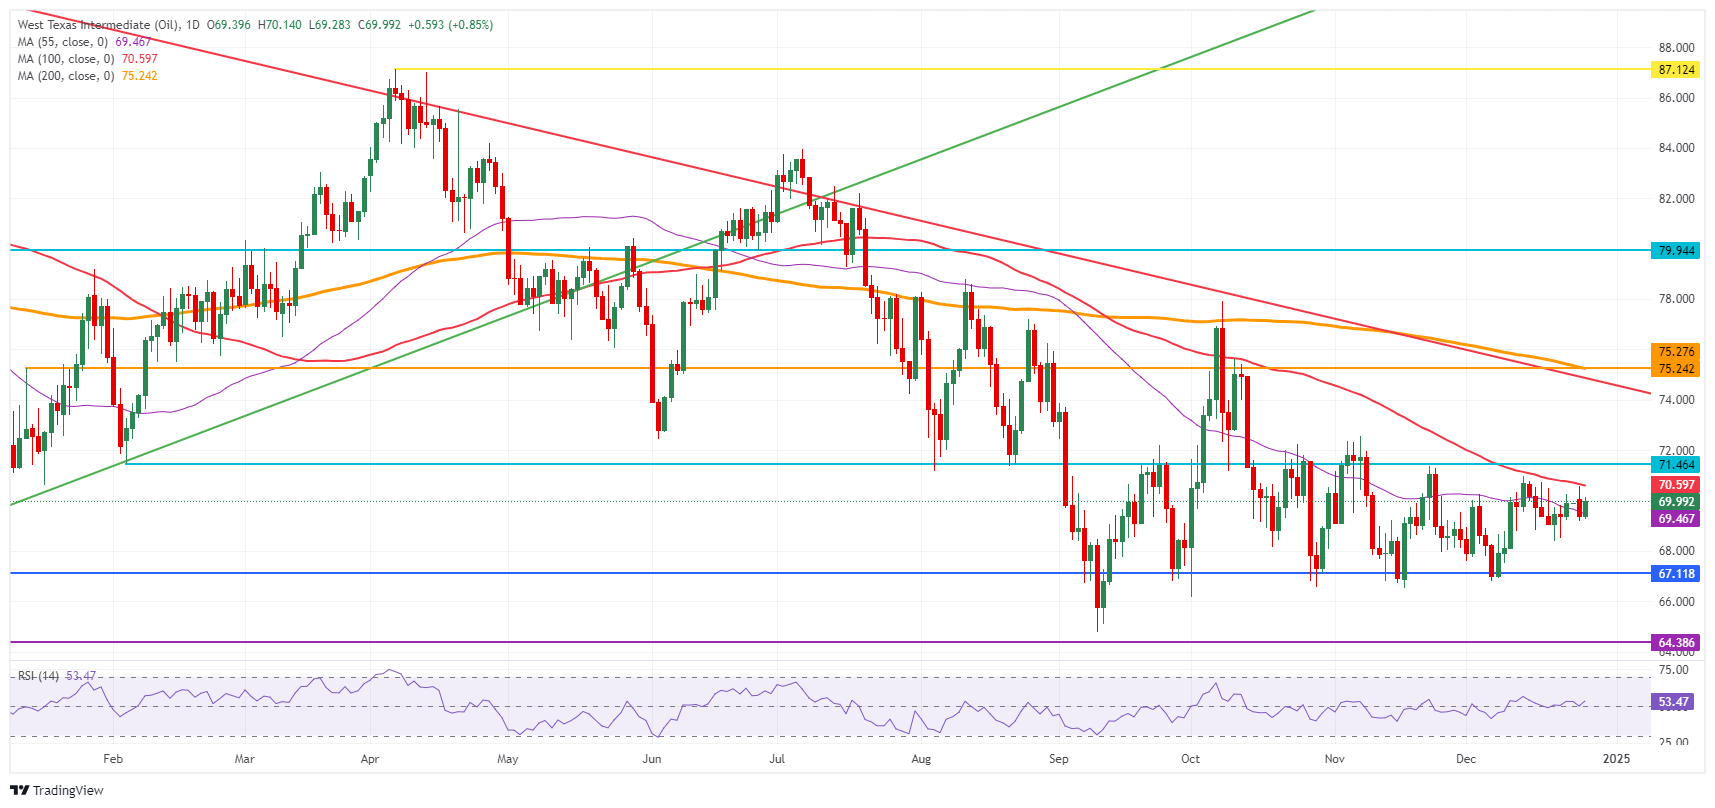
US WTI Crude Oil: Daily Chart
WTI Oil FAQs
WTI Oil is a type of Crude Oil sold on international markets. The WTI stands for West Texas Intermediate, one of three major types including Brent and Dubai Crude. WTI is also referred to as “light” and “sweet” because of its relatively low gravity and sulfur content respectively. It is considered a high quality Oil that is easily refined. It is sourced in the United States and distributed via the Cushing hub, which is considered “The Pipeline Crossroads of the World”. It is a benchmark for the Oil market and WTI price is frequently quoted in the media.
Like all assets, supply and demand are the key drivers of WTI Oil price. As such, global growth can be a driver of increased demand and vice versa for weak global growth. Political instability, wars, and sanctions can disrupt supply and impact prices. The decisions of OPEC, a group of major Oil-producing countries, is another key driver of price. The value of the US Dollar influences the price of WTI Crude Oil, since Oil is predominantly traded in US Dollars, thus a weaker US Dollar can make Oil more affordable and vice versa.
The weekly Oil inventory reports published by the American Petroleum Institute (API) and the Energy Information Agency (EIA) impact the price of WTI Oil. Changes in inventories reflect fluctuating supply and demand. If the data shows a drop in inventories it can indicate increased demand, pushing up Oil price. Higher inventories can reflect increased supply, pushing down prices. API’s report is published every Tuesday and EIA’s the day after. Their results are usually similar, falling within 1% of each other 75% of the time. The EIA data is considered more reliable, since it is a government agency.
OPEC (Organization of the Petroleum Exporting Countries) is a group of 12 Oil-producing nations who collectively decide production quotas for member countries at twice-yearly meetings. Their decisions often impact WTI Oil prices. When OPEC decides to lower quotas, it can tighten supply, pushing up Oil prices. When OPEC increases production, it has the opposite effect. OPEC+ refers to an expanded group that includes ten extra non-OPEC members, the most notable of which is Russia.
Author

Filip Lagaart
FXStreet
Filip Lagaart is a former sales/trader with over 15 years of financial markets expertise under its belt.


