Copper Price Analysis: Dr Copper prescribes upbeat tone, marred by critical multi-timeframe supply zone
- On the hourly time frame, the rally is parabolic and likely in need of a meanwhile correction in the coming hours.
- There is a case for the move back towards the prior highs near 4.4370.

There has been a more positive outlook for China with restrictions being eased which has been supporting base metals as bargain hunters pile in, encouraged also by positive economic data elsewhere, such as in the US and eurozone. US manufacturing activity unexpectedly advanced in May, with the ISM factory index rising to 56.1 from 55.4. The euro area PMI ticked up to 54.6 in May versus a flash reading of 54.4.
Copper has been leading the sector higher, with CFD's trading higher by over 5% on the day so far. the contract is nearly 13% up from the May 12 lows after reaching a high of 4.567.
''With restrictions in Shanghai being to ease, the worst of the recent economic weakness may be behind it. Chinese officials are also ramping up efforts to boost economic activity,'' analysts at ANZ Bank argued.
From a technical standpoint, however, there could be a correction in store on the near term charts. However, there is also the case for a much longer-term negative outlook on the charts as well and the following illustrates the market structure on a multi-time-frame basis:
Copper monthly chart
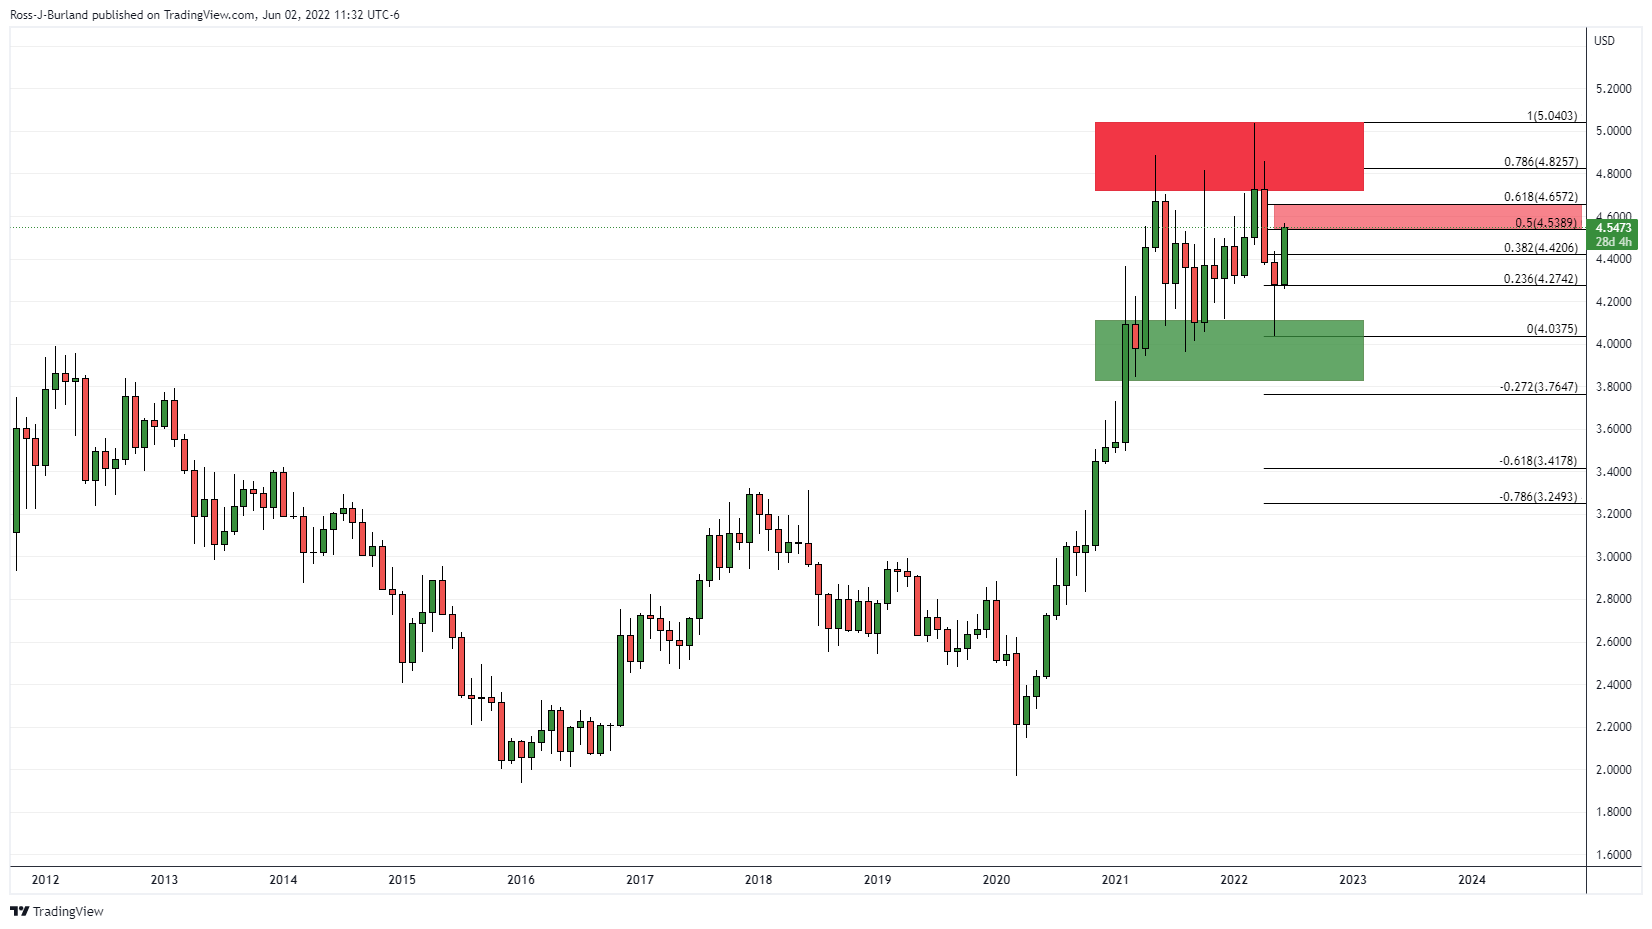
For just over a year, the price has been consolidating the 2020 bull rally. In the past weeks, the price has made a strong 50% mean reversion. This could signify more to go on the upside given the strength of the correction.
Copper weekly chart
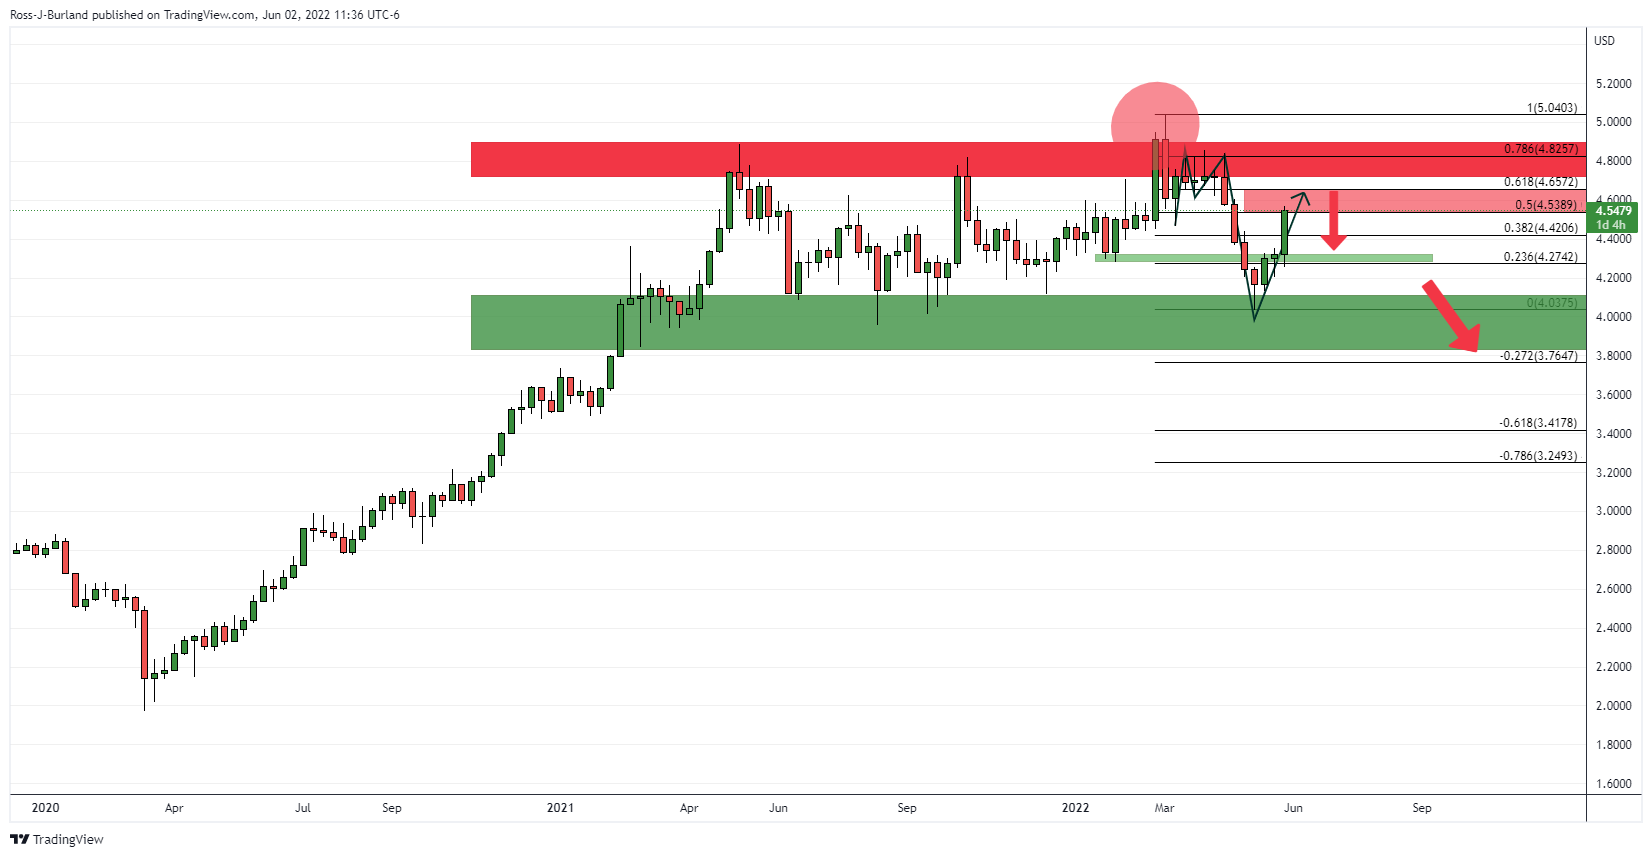
The weekly chart is more interesting. The price made a jolt through the highs of resistance from the middle of the range but quickly reverted lower and continued lower to meet the support of the channel. The bears are in control overall. This could mean that the current bullish correction is about to meet committed bears as it moved in on the neckline of the M-formation. This is an area that would be expected to act as resistance on initial tests. If it does and the best commit, a case for the downside will start to build again. 4.2780s will be key in protecting against a downside continuation and a fresh low below the channel's support for the weeks ahead.
Copper daily chart
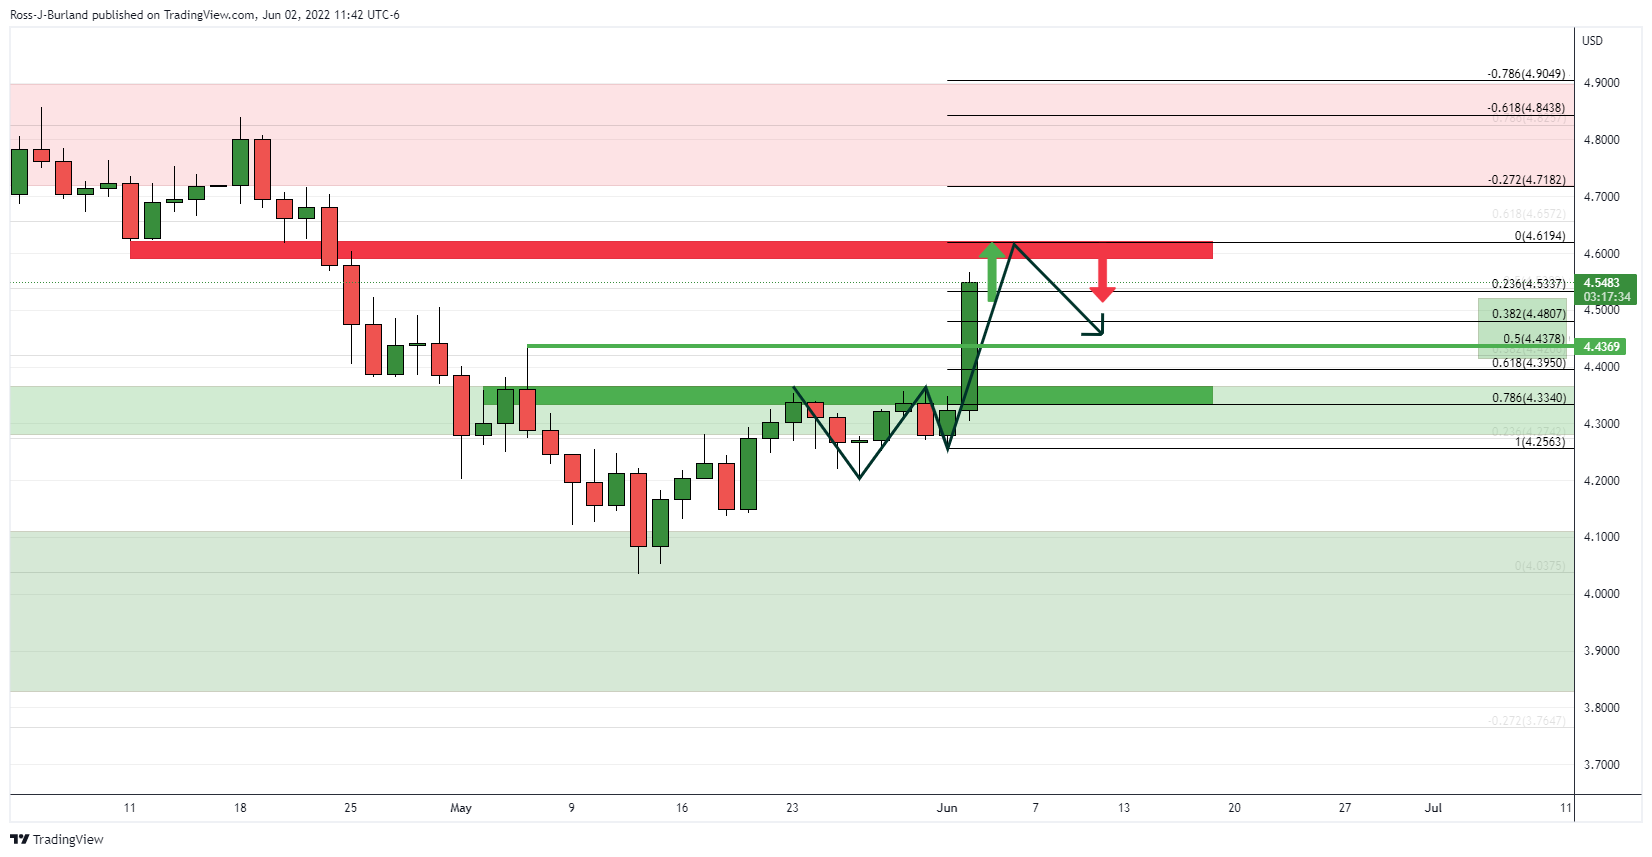
The extended W-formation on the daily chart is a bearish feature should the price fail to break above the resistance at 4.6215 for the days ahead, as illustrated above. The 61.8% ratio that has a confluence with prior wick highs could be targeted near 4.4370.
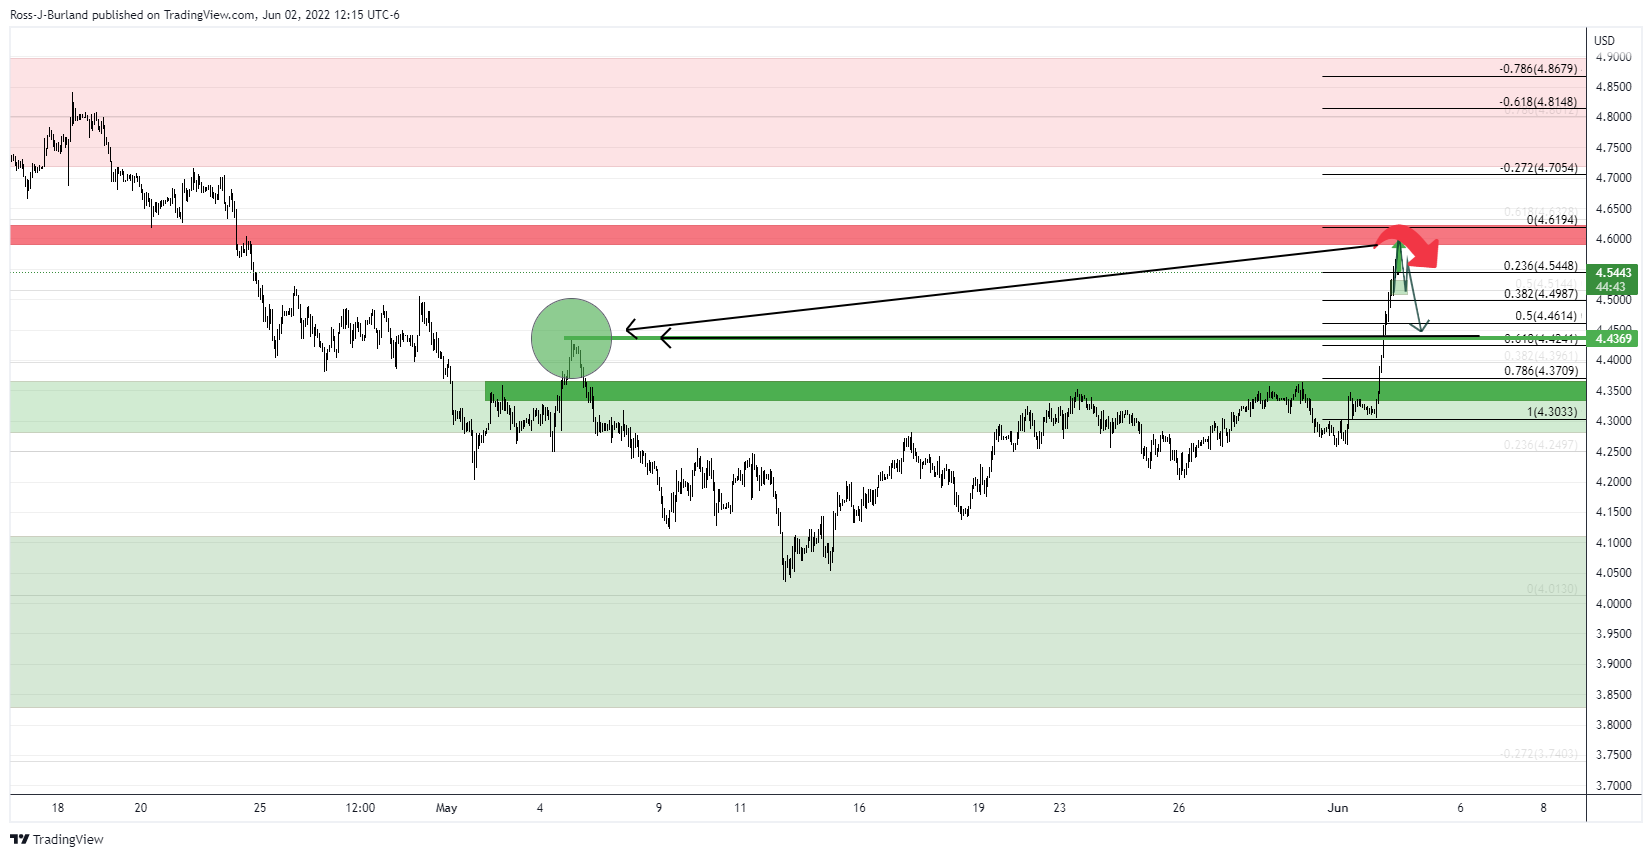
Copper hourly chart
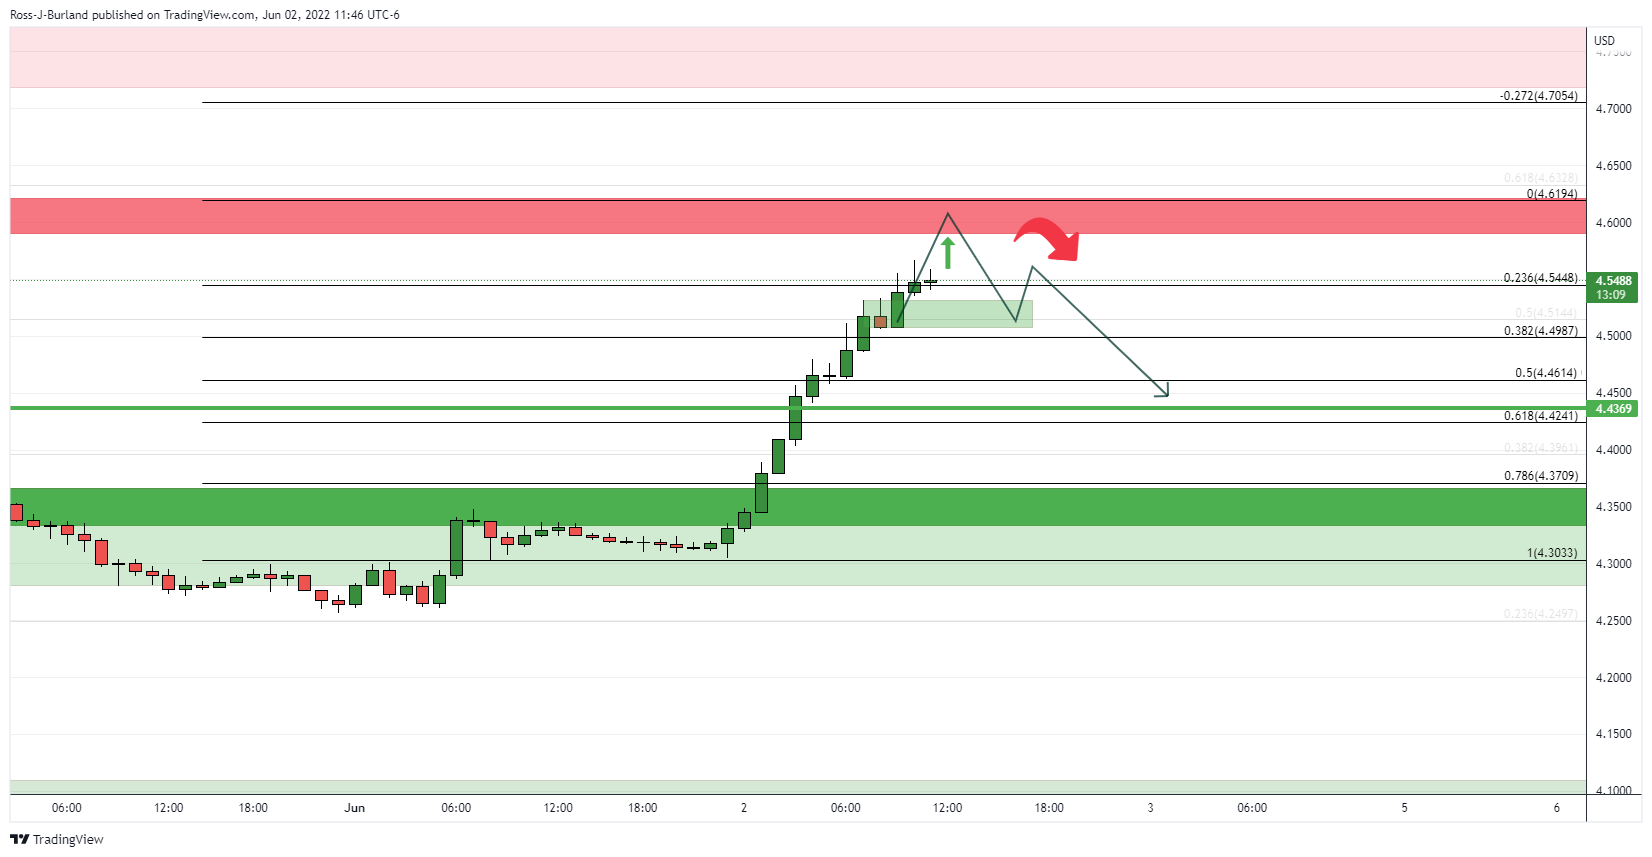
On the hourly time frame, the rally is parabolic, besides a brief stall at 4.5330 and likely in need of a meanwhile correction in the coming hours. If the bears manage to break below the potential support structure where the bulls paused for breath previously within this rally, then that will reinforce the case for the move back towards the prior highs:
Author

Ross J Burland
FXStreet
Ross J Burland, born in England, UK, is a sportsman at heart. He played Rugby and Judo for his county, Kent and the South East of England Rugby team.


