COH Elliott Wave technical forecast [Video]
![COH Elliott Wave technical forecast [Video]](https://editorial.fxsstatic.com/images/i/General-Stocks_1_XtraLarge.png)
COH Elliott Wave technical analysis
-
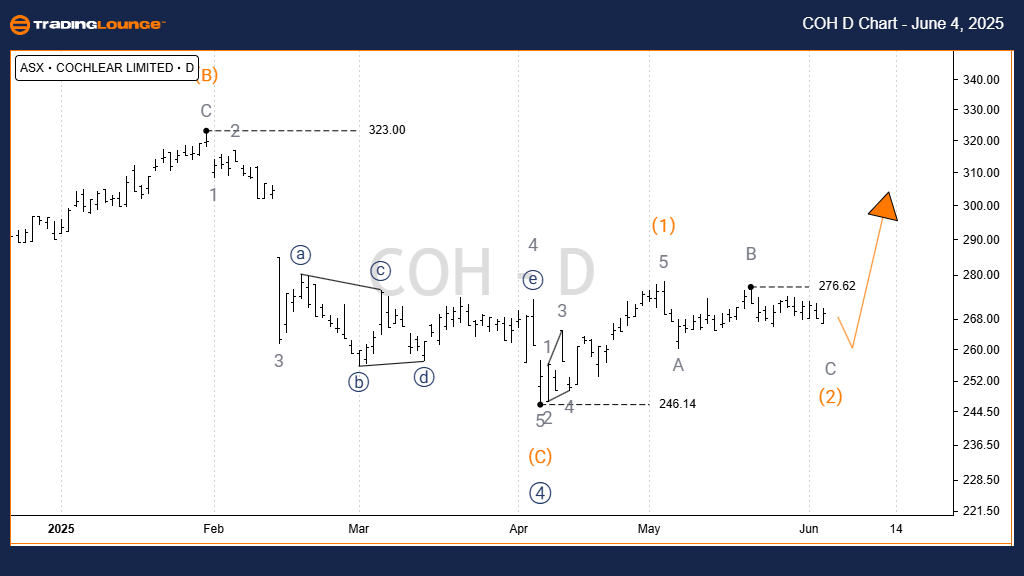
Function: Major Trend (Intermediate Degree – Orange).
-
Mode: Motive.
-
Structure: Impulse.
-
Current position: Wave 5)) – Navy.
Analysis summary:
Wave 4)) – Navy seems to have wrapped up the A-B-C correction in orange. The market now appears ready to begin wave 5)) – Navy, favoring a bullish direction. Price action may return to the high seen in wave 3)) – Navy at around $350.00.
-
Key confirmation level: 276.620 (indicates wave 3) – Orange developing).
-
Invalidation level: 246.14.
COH Elliott Wave technical analysis
-
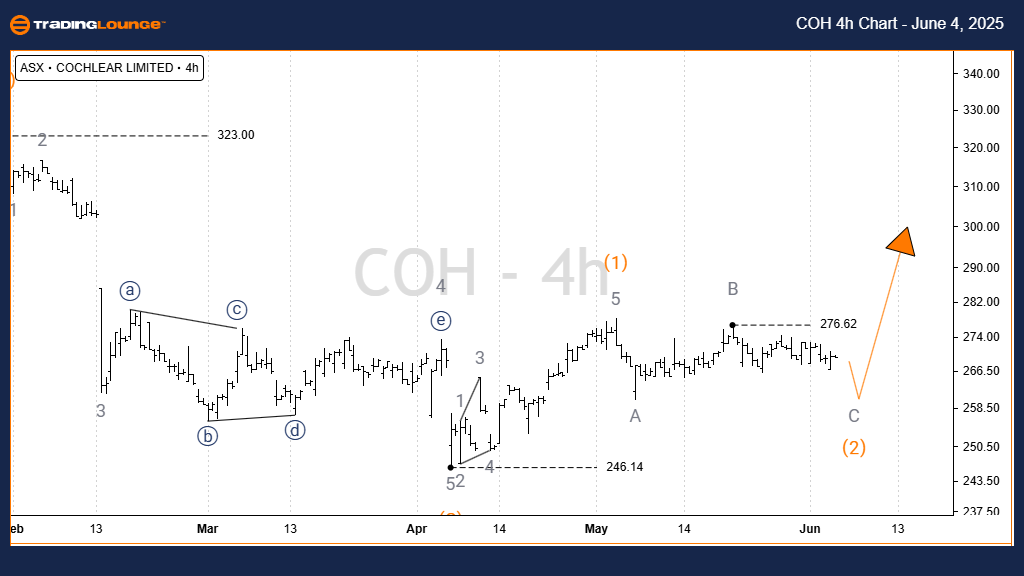
Function: Major Trend (Intermediate Degree – Orange).
-
Mode: Motive.
-
Structure: Impulse.
-
Current Position: Wave B – Grey of Wave 2) – Orange.
Analysis summary:
From the 246.140 low, wave 1) – Orange completed as a Leading Diagonal. Wave 2) – Orange likely dipped deep, with wave A and B already formed. One more downward move with wave C – Grey is expected before a bullish wave 3) – Orange can commence.
-
Key confirmation level: 276.62.
-
Invalidation level: 246.14.
Conclusion:
Our updated forecast for COCHLEAR LIMITED - COH identifies ongoing market trends and key turning points. By providing specific invalidation and confirmation price levels, this technical outlook increases trader confidence and strategic clarity. The insights aim to offer a clear and structured guide for navigating upcoming market moves.
COH Elliott Wave technical analysis [Video]
Author

Peter Mathers
TradingLounge
Peter Mathers started actively trading in 1982. He began his career at Hoei and Shoin, a Japanese futures trading company.


