|

Caterpillar Inc., (CAT) Elliott Wave technical analysis [Video]

CAT Elliott Wave technical analysis 

Function: Trend.  

Mode: Motive.

Structure: Impulsive. 

Position: Wave (iii) of {iii}.  

Direction: Upside within wave {iii}. 

Details: Looking for upside into Minute wave {iii} as we seem to be taking off 350$.  

Chart

CAT Elliott Wave technical analysis 

Function: Trend.

Mode: Motive.

Structure: Impulsive. 

Position: Wave v of (iii). 

Direction: Upside in wave v.  

Details: We seem to be missing upside within subminuette wave v. Looking for continuation higher to then top in Minuette wave (iii).  

Chart

This analysis focuses on the current trend structure of Caterpillar Inc., (CAT) utilizing the Elliott Wave Theory on both the daily and 1-hour charts. Below is a breakdown of the stock's position and potential future movements. 

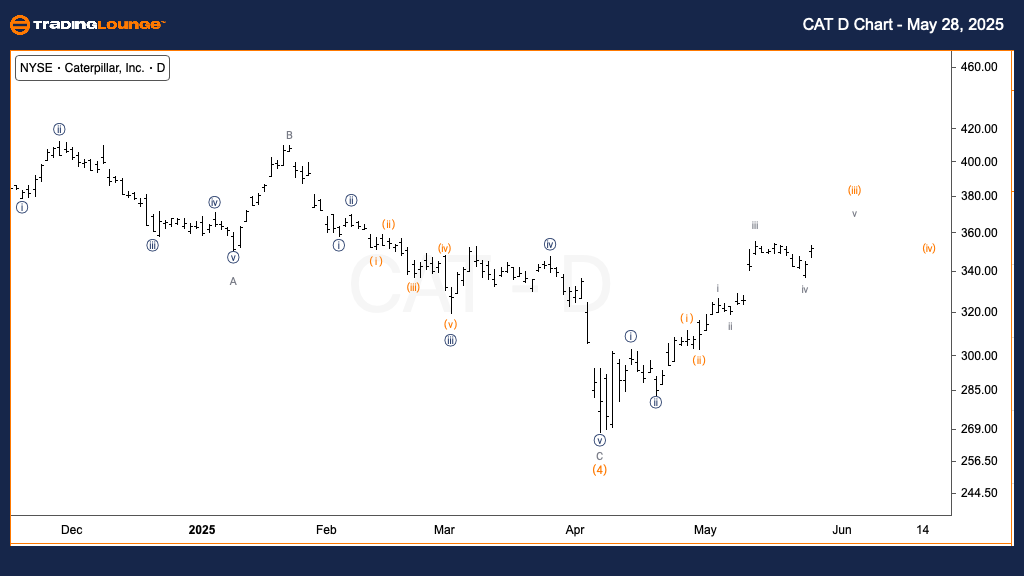
CAT Elliott Wave technical analysis – daily chart

Caterpillar (CAT) is showing bullish strength as price action breaks above the key $350 level, suggesting the beginning of a strong move in Minute wave {iii}. The impulsive structure signals continuation higher, aligning with the broader uptrend. Further confirmation would come with sustained price action above recent highs. 

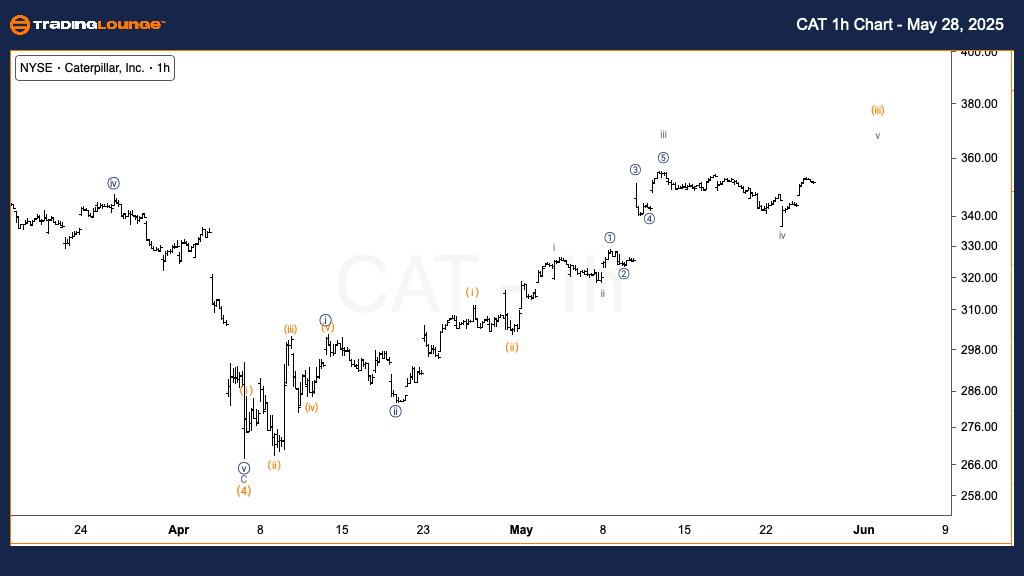
CAT Elliott Wave technical analysis – One-hour chart

On the intraday chart, CAT appears to be completing the final leg of subminuette wave v within Minuette wave (iii). The price structure suggests one more push to the upside before a potential pullback in wave (iv). Watch for resistance near key technical levels as the impulsive wave matures. 

Caterpillar Inc., (CAT) Elliott Wave technical analysis [Video]

Author

Peter Mathers

Peter Mathers

TradingLounge

Peter Mathers started actively trading in 1982. He began his career at Hoei and Shoin, a Japanese futures trading company.

More from Peter Mathers
Share:

Editor's Picks

EUR/USD flirts with daily highs, retargets 1.1900

EUR/USD regains upside traction, returning to the 1.1880 zone and refocusing its attention to the key 1.1900 barrier. The pair’s slight gains comes against the backdrop of a humble decline in the US Dollar as investors continue to assess the latest US CPI readings and the potential Fed’s rate path.

GBP/USD remains well bid around 1.3650

GBP/USD maintains its upside momentum in place, hovering around daily highs near 1.3650 and setting aside part of the recent three-day drop. Cable’s improved sentiment comes on the back of the Greenback’s  irresolute price action, while recent hawkish comments from the BoE’s Pill also collaborate with the uptick.

Gold clings to gains just above $5,000/oz

Gold is reclaiming part of the ground lost on Wednesday’s marked decline, as bargain-hunters keep piling up and lifting prices past the key $5,000 per troy ounce. The precious metal’s move higher is also underpinned by the slight pullback in the US Dollar and declining US Treasury yields across the curve.

Crypto Today: Bitcoin, Ethereum, XRP in choppy price action, weighed down by falling institutional interest 

Bitcoin's upside remains largely constrained amid weak technicals and declining institutional interest. Ethereum trades sideways above $1,900 support with the upside capped below $2,000 amid ETF outflows.

Week ahead – Data blitz, Fed Minutes and RBNZ decision in the spotlight

US GDP and PCE inflation are main highlights, plus the Fed minutes. UK and Japan have busy calendars too with focus on CPI. Flash PMIs for February will also be doing the rounds. RBNZ meets, is unlikely to follow RBA’s hawkish path.

Ripple Price Forecast: XRP potential bottom could be in sight

Ripple edges up above the intraday low of $1.35 at the time of writing on Friday amid mixed price actions across the crypto market. The remittance token failed to hold support at $1.40 the previous day, reflecting risk-off sentiment amid a decline in retail and institutional sentiment.