Canadian Dollar flattens amid holiday-thinned markets
- The Canadian Dollar is mostly flat near familiar territory on Thursday.
- Canada GDP figures due Friday to draw some attention from Loonie traders.
- Market volumes are notably thin with US markets shuttered for Thanksgiving.

The Canadian Dollar (CAD) traded thinly on Thursday, sticking to the 1.4000 handle against the Greenback as global markets grind into slow gear in the latter half of the trading week with overall market volumes crimped by a lack of flow from US institutions. US markets are shuttered in observation of the Thanksgiving holiday today, and a shortened day for American markets on Friday also bodes poorly for consistent market moves to wrap up the week.
Canada will be printing updates to Gross Domestic Product (GDP) growth figures on Friday, leaving Loonie traders in the lurch for Thursday. Still, Canadian Current Account figures came in better than expected, helping to muscle the CAD into a slightly higher stance on the day.
Daily digest market movers: Canadian Dollar propped up by holiday markets
- The Canadian Dollar gains a scant tenth of a percent on Thanksgiving Thursday.
- Market flows have dried up with the US on holiday. Friday volumes will likely be constrained as well.
- Canada’s Current Account came in at -3.23 billion in the third quarter, better than the expected -9.3 billion and rebounding from the previous quarter’s revised -4.7 billion, which was initially released at -8.4 billion.
- On Friday, Canada’s third quarter GDP growth is expected to ease to just 1.0% on an annualized basis, down from the previous 2.1%.
- On a month-on-month basis, Canadian GDP is forecast to swing up to 0.3% MoM in September compared to August’s flat 0.0% print.
Canadian Dollar price forecast
The Canadian Dollar’s (CAD) is seeing a tepid rebound after tapping a 55-month low this week. The CAD has gained an intraday foothold against the US Dollar, dragging the USD/CAD pair back into the 1.4000 handle. The pair is still caught on the high end following a broad-market bull run in the Greenback. Still, technical traders will have an increasingly difficult time ignoring the growing potential for a cyclical turnaround in the long-term charts.
USD/CAD daily chart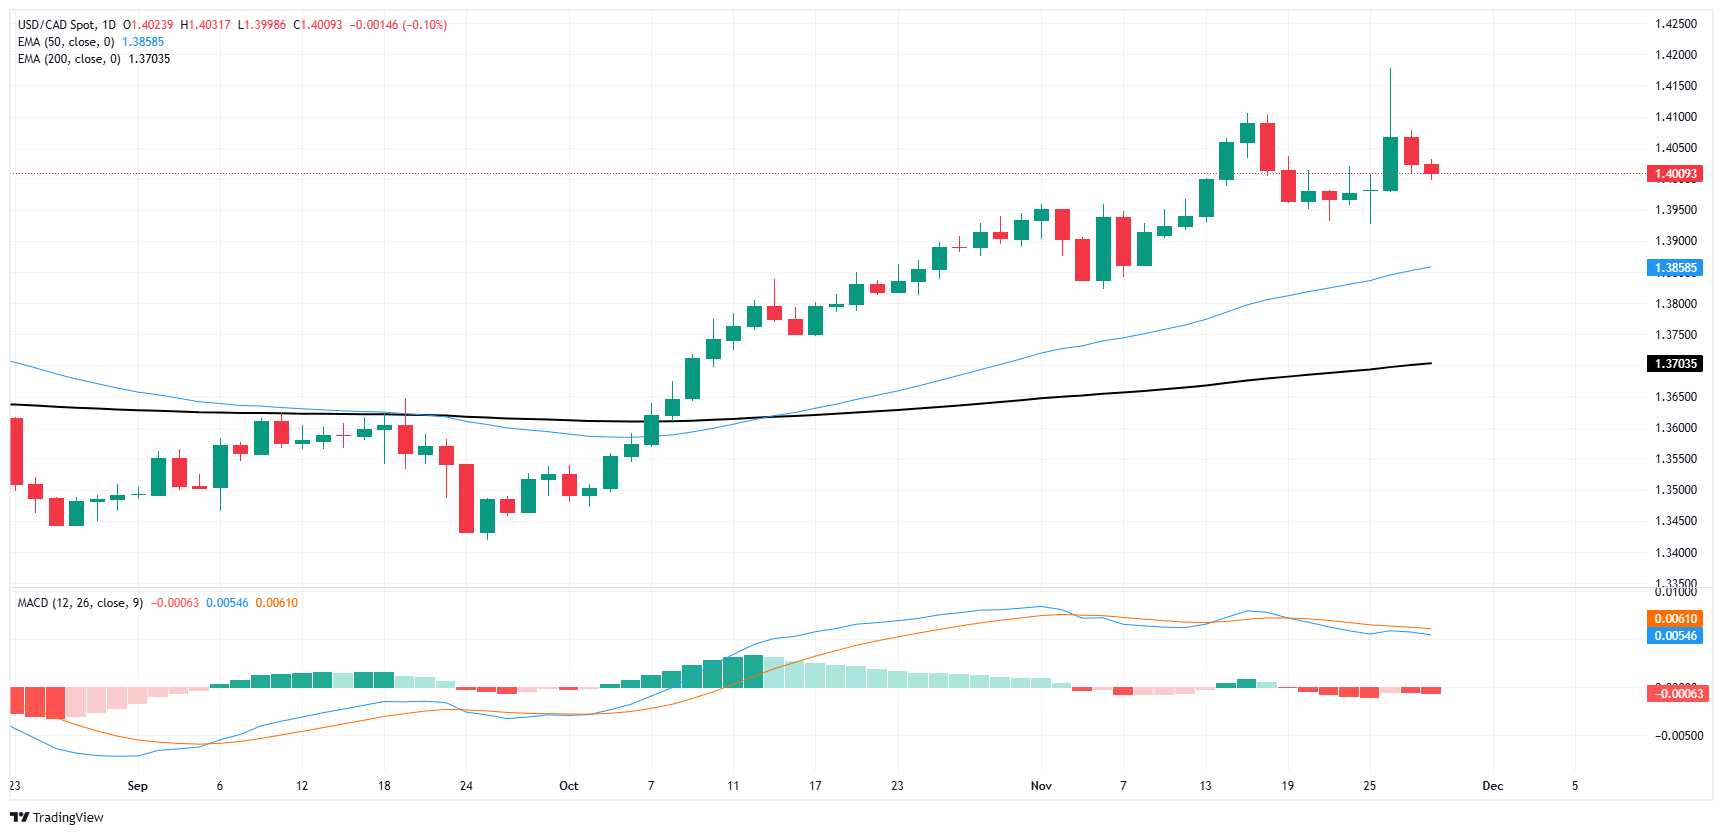
Economic Indicator
Gross Domestic Product (MoM)
The Gross Domestic Product (GDP), released by Statistics Canada on a monthly and quarterly basis, is a measure of the total value of all goods and services produced in Canada during a given period. The GDP is considered as the main measure of Canadian economic activity. The MoM reading compares economic activity in the reference month to the previous month. Generally, a high reading is seen as bullish for the Canadian Dollar (CAD), while a low reading is seen as bearish.
Read more.Author

Joshua Gibson
FXStreet
Joshua joins the FXStreet team as an Economics and Finance double major from Vancouver Island University with twelve years' experience as an independent trader focusing on technical analysis.

















