|

Cameco (CCJ) breaks out as impulsive strength returns

Cameco is a leading Canadian uranium producer based in Saskatoon. The company operates some of the world’s highest‑grade and lowest‑cost uranium mines. It also maintains a significant presence across the nuclear fuel cycle through refining, conversion, and fuel‑manufacturing assets. In this article, we will look at the long term Elliott Wave path.

Cameco ($CCJ) monthly Elliott Wave chart

Chart

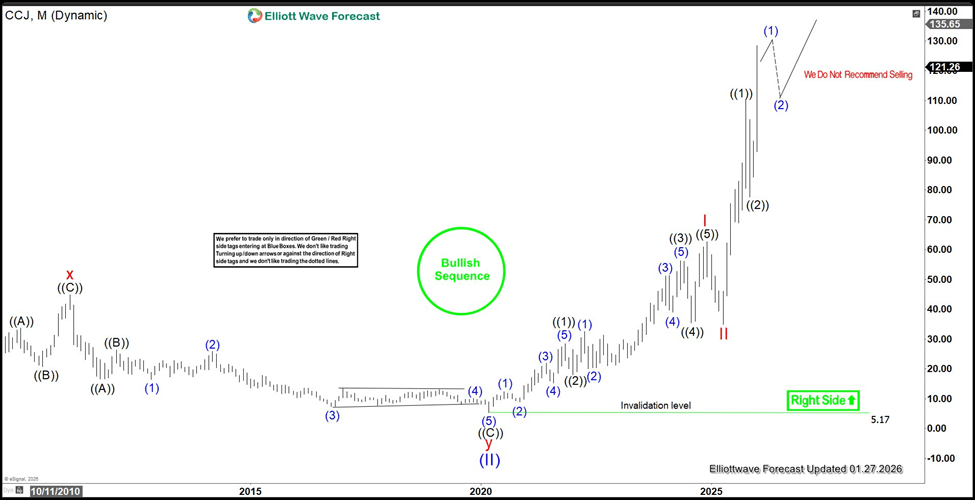
The monthly Elliott Wave chart for Cameco (CCJ) indicates that wave (II) of the Super Cycle ended at $5.17. From there, a powerful impulsive advance in wave (III) followed. From the wave (II) low, wave I completed at $62.55, and the subsequent pullback in wave II finished at $35. The stock then resumed higher in a nesting sequence, with wave ((1)) ending at $110.16 and wave ((2)) pulling back to $77.7. As long as price holds above $5.17, any pullback should find support in a 3‑, 7‑, or 11‑swing structure, with the broader trend favoring further upside.

$CCJ daily Elliott Wave chart

Chart

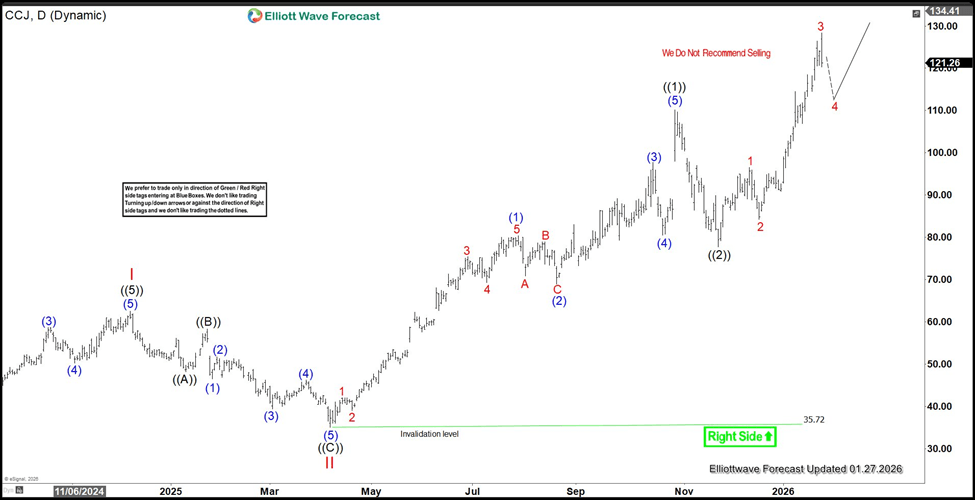
The daily Elliott Wave analysis of Cameco (CCJ) shows that wave II completed at $35.72. From that low, the stock resumed higher in wave III, which is unfolding as a five‑wave impulse. Within this advance, wave ((1)) peaked at $110.16, followed by a pullback in wave ((2)) that ended at $77.7. In the near term, as long as the pivot at $35.72 remains intact, any pullback is expected to find support in a 3‑, 7‑, or 11‑swing structure, setting the stage for further upside.

Author

Elliott Wave Forecast Team

Elliott Wave Forecast Team

ElliottWave-Forecast.com

More from Elliott Wave Forecast Team
Share:

Editor's Picks

EUR/USD remains firm above 1.1900

EUR/USD resumed its upward march after a brief and orderly pullback, pushing up to the 1.1930 area, its strongest level since June 2021. The pair’s advance reflects a steady loss of appetite for the US Dollar amid the broader inmprovement in market sentiment, with investors once again zeroing in on tariff risks linked to President Trump.

GBP/USD hits multi-month highs around 1.3750

GBP/USD is trading at fresh multi-month highs around 1.3750 as broad-based weakness continues to hurt the Greenback on Tuesday, all after fresh headlines suggested President Trump has reignited the trade war, souring sentiment towards the buck ahead of the Fed meeting.

Gold stays bid near $5,100

Gold keeps the bid tone well in place, approaching the $5,100 mark per troy ounce on Tuesday. The precious metal continues to draw support from a struggling US Dollar, ongoing uncertainty around trade policy and geopolitical risks.

Bitcoin steadies as winter storm drops hashrate, BlackRock files for Premium Income ETF

Bitcoin (BTC) trades near $88,000 at press time on Tuesday, after reaching an intraday high of $89,010, and reflects an ease in buying pressure after Monday’s 2% rise. 

Trump tariff threats seemingly fall on deaf ears – Focus turns to Fed and Aussie CPI

US President Donald Trump ramped up trade tensions with South Korea yesterday after stating that Seoul is ‘not living up to its deal with the US’, as shown below via his Truth Social platform. 

Axie Infinity Price Forecast: AXS rallies as bAXS token reveal boosts retail demand

Axie Infinity is up 3% at press time on Tuesday, extending the 21% gains from Monday and a bullish start to the week. The gaming token regains retail demand following the announcement of its app token, bAXS, to replace the AXS token across the ecosystem and gameplay rewards.