|

Block Inc. Elliott Wave technical forecast [Video]

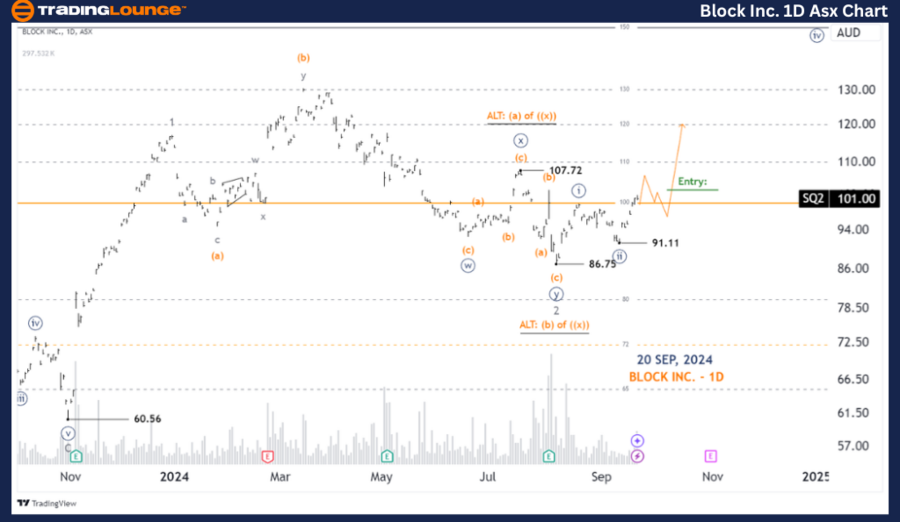
ASX: SQ2 Elliott Elliott Wave technical analysis 

Greetings, Our Elliott Wave analysis today updates the Australian Stock Exchange (ASX) with BLOCK INC. - SQ2. We are seeing a potential bullish opportunity with wave (iii)-orange of wave ((iii))-navy.

ASX: SQ2 one-day chart (semilog scale) analysis

Function: Major trend (Minor degree, gray). 

Mode: Motive. 

Structure: Impulse. 

Position: Wave ((iii))-navy of Wave 3-grey. 

Details: The ((iii))-navy wave looks to be unfolding to push higher, while price must remain above 91.11 to maintain this view. I will look for a Long Trade Setup once we have support at the Major Level 100.00. 

Invalidation point: 91.11. 

Block

ASX: SQ2 four-hour chart analysis

Function: Major trend (Minor degree, grey). 

Mode: Motive. 

Structure: Impulse. 

Position: Wave (i)-orange of Wave ((iii))-navy. 

Details: From the low at 86.75, wave 3-grey is unfolding to push higher, which itself subdivides into wave (i)-orange of wave ((iii))-navy. Basically, wave (i)-orange could push a little higher, then wave (ii)-orange should come back to push lower, and finally wave (iii)-orange of wave ((iii))-navy could come back to continue pushing higher. I would look for a Long Trade Setup on support from the Major Level 100.00. 

Invalidation point: 91.11.

block

Conclusion

Our analysis, forecast of contextual trends, and short-term outlook for ASX: BLOCK INC. - SQ2 aim to provide readers with insights into the current market trends and how to capitalize on them effectively. We offer specific price points that act as validation or invalidation signals for our wave count, enhancing the confidence in our perspective. By combining these factors, we strive to offer readers the most objective and professional perspective on market trends.

Block Inc. Elliott Wave technical forecast [Video]

Author

Peter Mathers

Peter Mathers

TradingLounge

Peter Mathers started actively trading in 1982. He began his career at Hoei and Shoin, a Japanese futures trading company.

More from Peter Mathers
Share:

Editor's Picks

AUD/USD falls to near 0.7100 after slipping below 50-day EMA

AUD/USD depreciates after registering minor gains in the previous day, trading around 0.7120 during the Asian hours. The technical analysis of the daily chart shows the pair consolidating sideways within a rectangle pattern, as neither bulls nor bears gain control. The AUD/USD pair is holding a slight bearish tone however as it sits beneath both the nine-day and 50-day EMAs.

USD/JPY consolidates near 160.00 as US NFP takes centre stage

The USD/JPY pair trades in a tight range around 160.00 during the European trading session. The pair wobbles as investors await the United States Nonfarm Payrolls data for May, which will be published at 12:30 GMT. Investors will closely monitor the employment data to get fresh cues regarding the Federal Reserve’s monetary policy outlook.

Gold returns to the red, awaits US NFP

Gold price is looking to test the weekly lows, while in the red near $4,450 in the early European session on Friday. The precious metal remains vulnerable amid ongoing geopolitical turmoil. Traders will closely monitor the developments surrounding the US-Iran peace deal and the US May employment report later on Friday.


Arthur Hayes' “Holy Trinity” is dead: Exits Zcash after Orchard Pool exploit

Arthur Hayes has entirely dumped his “Holy Trinity” holdings by offloading his Zcash holdings on Friday. The privacy coin is down 13% so far on Friday, extending Thursday’s 26% decline after an Orchard Shielded Pool audit revealed a critical vulnerability that allowed the undetectable minting of fake coins. Hayes continues to hold Worldcoin ahead of the upcoming SpaceX Initial Public Offering, on the chance of a “high-beta proxy” rally.

Nonfarm Payrolls set to show stable labor market in May as markets digest Fed hawkish shift

The United States Bureau of Labor Statistics will release the Nonfarm Payrolls data for May on Friday at 12:30 GMT. Investors expect NFP to rise by 85K following the surprisingly strong 185K and 115K increases recorded in March and April, respectively.

The US economy defies the rules: 100 days into the Oil shock and the recession signal is still missing

More than three months after the start of the Iran war and the resulting disruption to global energy markets, the US economy continues to display remarkable resilience. The conflict has triggered a sharp rise in Oil prices, reignited inflationary pressures and fueled widespread concerns about a potential economic slowdown.