|

Bitfarms Ltd. ($BITF) soars 400% from the blue box area – What’s next?

In today’s update, we’ll revisit the Elliott Wave structure of Bitfarms Ltd. ($BITF) and provide insights into the next phase of its price action. You can check the last article here. As anticipated, the 5-wave impulsive cycle from April 2025 has concluded, and a corrective pullback has begun. This pullback presents a potential buying opportunity in the coming weeks. Let’s break it down.

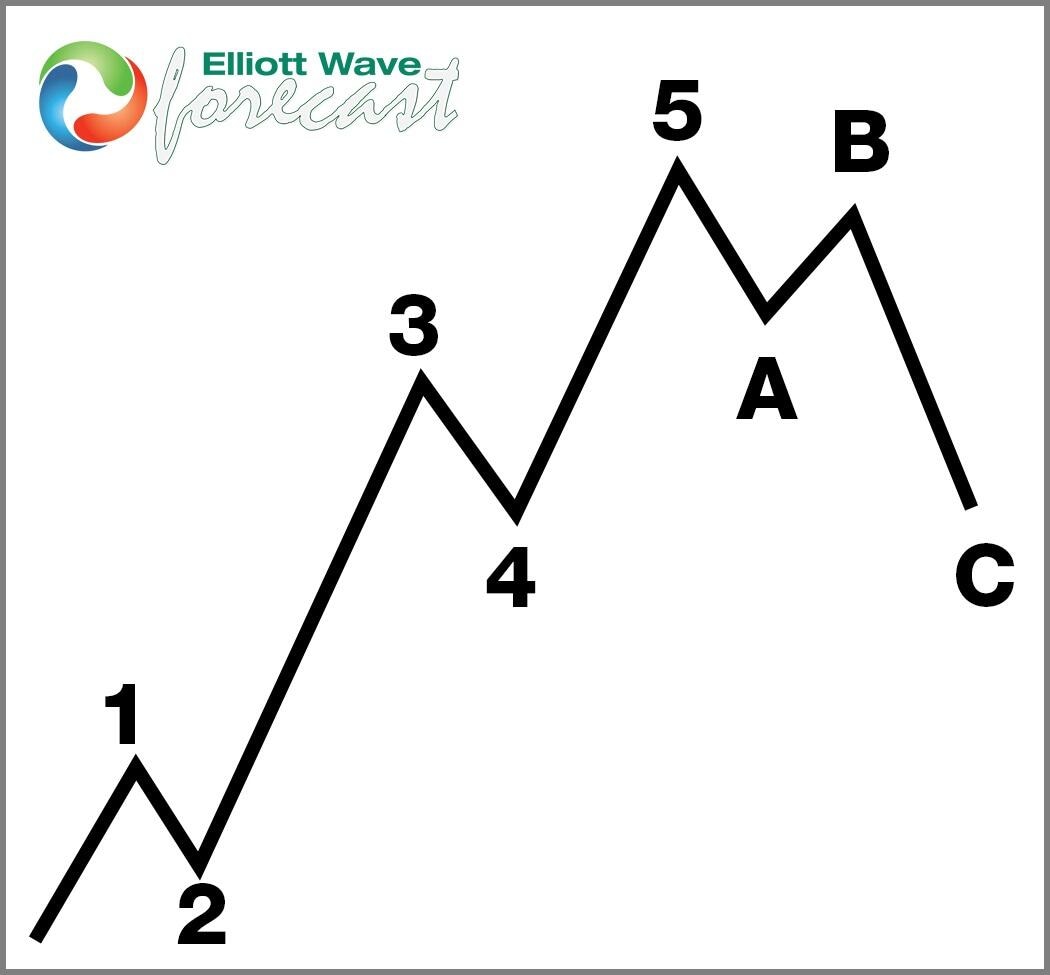
Five wave impulse structure + ABC correction

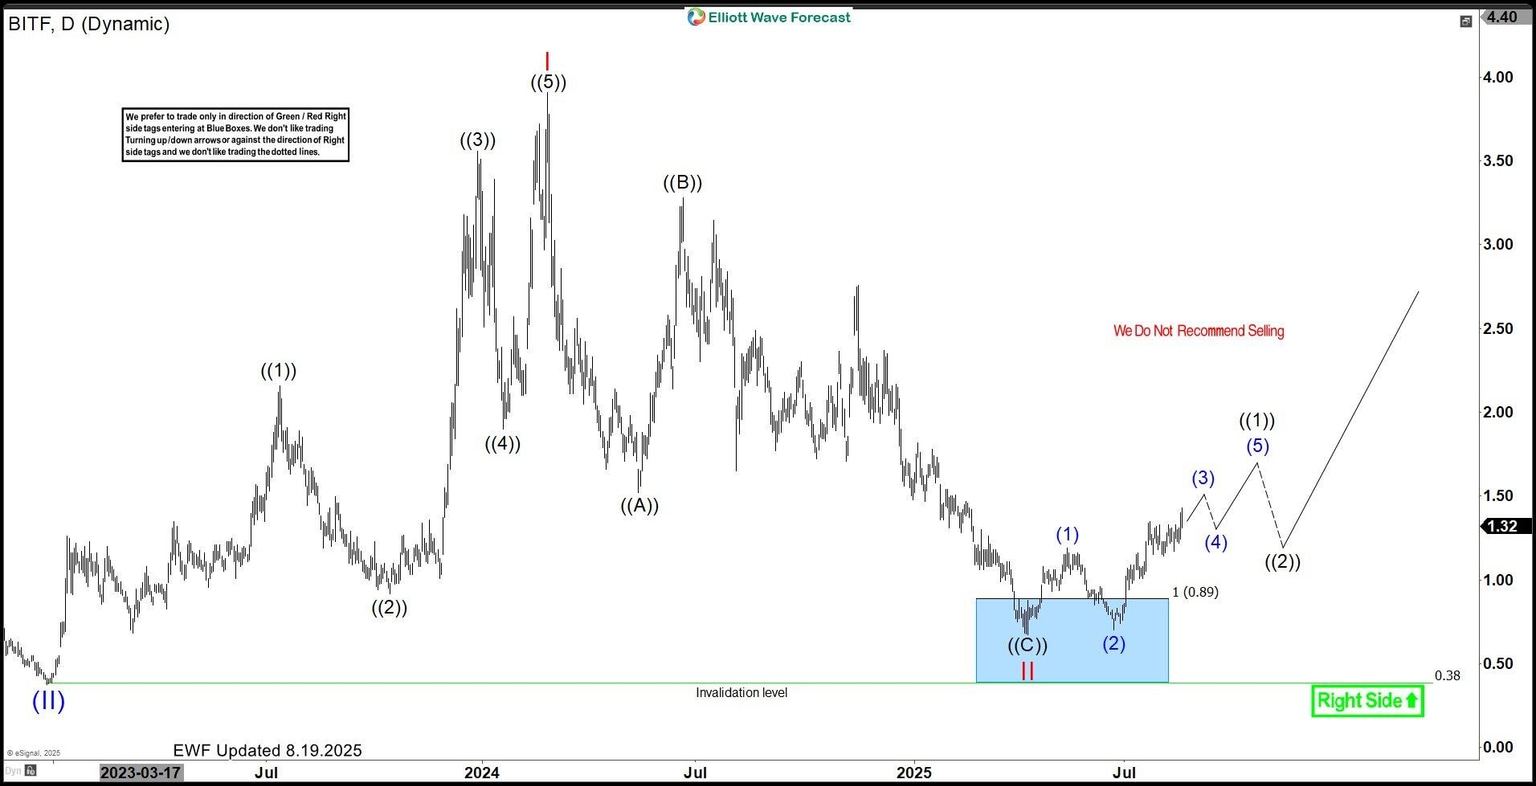
$BITF daily Elliott Wave view August 19th 2025

$BITF daily Elliott Wave view October 28th 2025

Since our last update, $BITF has rallied and confirmed the completion of wave (5) within wave ((1)). The stock has now entered a corrective phase, consistent with Elliott Wave Theory. Here’s how the structure is unfolding so far:

  • The first leg lower, labeled wave (A), has already formed, marking the initial phase of the pullback.
  • This was followed by a bounce in wave (B), which appears to be taking place.
  • The stock will soon enter wave (C) of the larger wave ((2)) correction, which should target the area at $3.63–$2.93.

Blue box area: A key buying opportunity

The Blue Box area represents a high-probability reversal zone where buyers could re-enter for the next bullish cycle. This correction, which follows the 5-wave impulse, allows the market to reset and create new opportunities for traders.

§  Wave Structure: Corrections typically unfold in 3 swings (ABC), with wave (C) often extending into the Blue Box.

As $BITF approaches this zone, traders should closely monitor price action for signs of reversal and a resumption of the larger uptrend.

What’s next for $BITF?

Once wave ((2)) completes in the Blue Box area, we expect $BITF to resume its bullish trend with a rally in wave ((3)). This next impulsive move could take the stock to new highs, continuing its uptrend.

Conclusion

The current correction in Bitfarms Ltd. ($BITF) aligns with our Elliott Wave analysis and offers a strategic buying opportunity. As the stock approaches the $3.63–$2.93 area, traders should prepare to capitalize on the next leg of the uptrend. Stay patient, focus on risk management, and let the Elliott Wave structure guide your decisions.

Author

Elliott Wave Forecast Team

Elliott Wave Forecast Team

ElliottWave-Forecast.com

More from Elliott Wave Forecast Team
Share:

Editor's Picks

EUR/USD holds above 1.1850 ahead of US data

EUR/USD stabilizes above 1.1850 after suffering heavy losses to end the previous week. The pair remains vulnerable to further downside as the US Dollar stays firm following President Donald Trump’s nomination of Kevin Warsh as the next Fed Chair. The focus now shifts to the US ISM Manufacturing PMI data. 

GBP/USD recovers to 1.3700 region following earlier drop

GBP/USD clings to small daily gains near 1.3700 after sliding toward 1.3650 earlier in the day. Traders weigh what a Federal Reserve under Kevin Warsh might look like, helping the US Dollar stay resilient against its peers and limiting the pair's upside ahead of the ISM Manufacturing Purchasing Managers Index report from the US.

Gold rebounds from monthly-low, stays below $4,800

Gold recovers from the monthly low it touched near $4,400 at the weekly opening but remains in negative territory below $4,800. The precious metal continues its downtrend after reaching historic highs last week as Kevin Warsh's nomination as the next Fed chair eases concerns over the US central bank’s independence, bolstering the US Dollar recovery. US ISM PMI Manufacturing PMI data is awaited. 

Crypto Today: Bitcoin, Ethereum, XRP extend correction amid mixed ETF flows, dwindling retail interest

Bitcoin consolidates above $77,000 after plummeting and testing April’s tariff-triggered lows, as investors remain cautious. Ethereum extends losses toward the psychological $2,000 support amid ETF outflows. XRP holds below its April low at $1.61 as futures Open Interest drops to $2.81 billion.

Warsh effect ripples through markets, central banks on deck this week

The first full month of the year is behind us, and, honestly, it has been rather more dramatic than most had anticipated when toasting the New Year. We wrapped up last week with US President Donald Trump announcing his Fed Chair pick. 

Bitcoin slips below $75,000 as selling pressure accelerates

Bitcoin (BTC) price falls below the $75,000 mark on Monday, having corrected nearly 11% in the previous week and reaching level not seen in nearly 10 months. Market momentum has clearly turned bearish, with technical indicators pointing to further downside toward the next key support at $70,000.