Bharat Electronics Elliott Wave technical analysis [Video]
![Bharat Electronics Elliott Wave technical analysis [Video]](https://editorial.fxstreet.com/images/TechnicalAnalysis/ChartPatterns/PointFigure/stock-market-data-18635784_XtraLarge.jpg)
BEL Elliott Wave technical analysis
Function: Larger Degree Trend Higher (Intermediate degree, orange).
Mode: Motive.
Structure: Impulse.
Position: Minute Wave ((ii)) Navy.
Details: Minute Wave ((iii)) Navy of Minor Wave 5 Grey is now progressing higher against 229, as Wave ((ii)) might be in place around 250-60. Alternatively Wave 5 Grey completed above 342.
Invalidation point: 229.
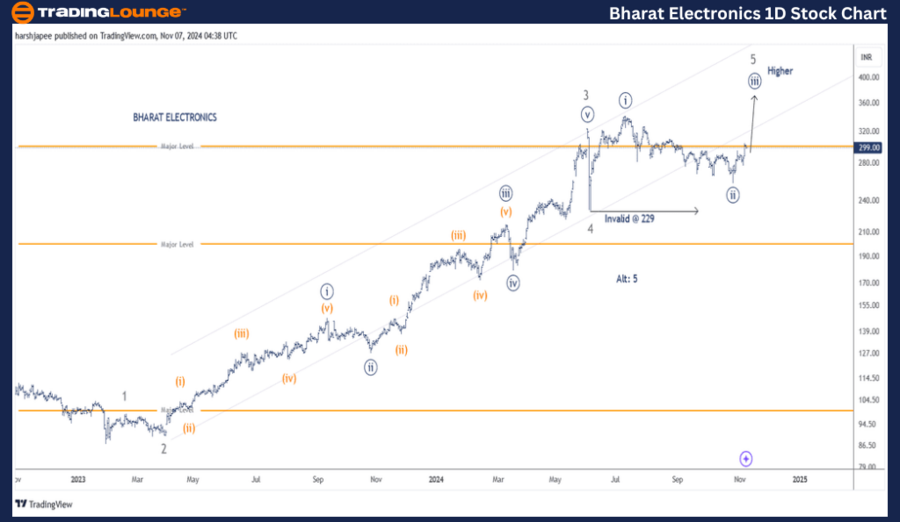
Bharat Electronics daily chart technical analysis and potential Elliott Wave counts
Bharat Electronics daily chart is indicating bulls are to remain in control until prices stay above 229 mark. The stock is still progressing higher to terminate Minor Wave 5 Grey above 350-70 range as Minute Wave ((iii)) begins to unfold.
The stock had earlier dropped through 87 lows in January 2023, potential Intermediate Wave (4). Since then, the rally could be subdivided into Minor Waves 1 through 4, which terminated around 229 mark. If correct, prices are now pushing higher as Minor Wave 5 is unfolding.
BEL Elliott Wave technical analysis
Function: Larger Degree Trend Higher (Intermediate degree, orange).
Mode: Motive.
Structure: Impulse.
Position: Minute Wave ((ii)) Navy.
Details: Minute Wave ((iii)) Navy of Minor Wave 5 Grey is now progressing higher against 229, as Wave ((ii)) might be in place around 250-60. Alternatively Wave 5 Grey completed above 342. Any break below 229 will void the bullish scenario.
Invalidation point: 229.
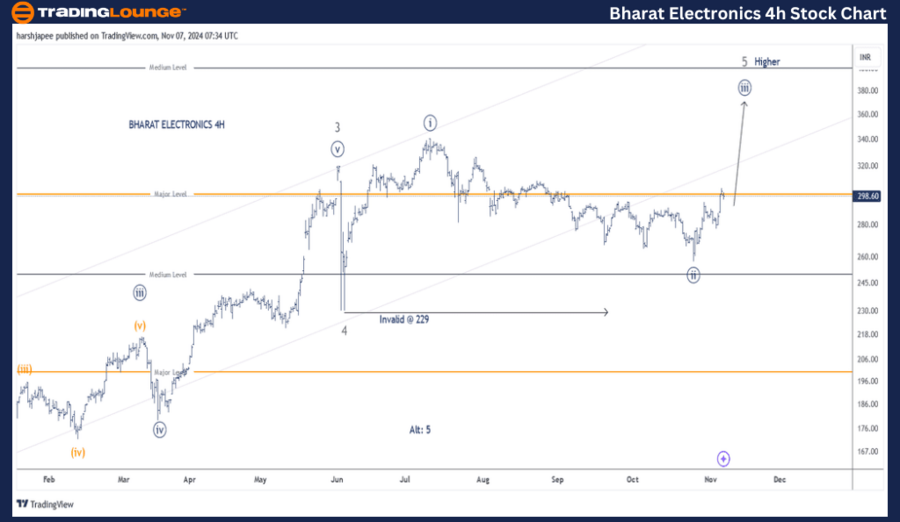
Bharat Electronics four-hour chart technical analysis and potential Elliott Wave counts
Bharat Electronics 4H chart is highlighting the sub waves after Minor Wave 3 terminated around 325 mark. Wave 4 was sharp to drop around 229 on June 03, 2024 and since then Minor Wave 5 is unfolding. Further, Minute Waves ((i)) and ((ii)) could be complete around 342 and 260 levels respectively. If correct, Minute Wave ((iii)) could be now underway. Bottom line is 229 for bulls to remain in control.
Conclusion
Bharat Electronics seem to be progressing higher within Minute Wave ((iii)) of Minor Wave 5 Grey against 229 mark.
Bharat Electronics Elliott Wave technical analysis [Video]
Author

Peter Mathers
TradingLounge
Peter Mathers started actively trading in 1982. He began his career at Hoei and Shoin, a Japanese futures trading company.


