Berkshire Hathaway Inc. (BRK.B) Stocks Elliott Wave technical analysis [Video]
![Berkshire Hathaway Inc. (BRK.B) Stocks Elliott Wave technical analysis [Video]](https://editorial.fxstreet.com/images/TechnicalAnalysis/ChartPatterns/Chartism/mobile-phone-with-stock-chart-62799468_XtraLarge.jpg)
BRK.B Elliott Wave Analysis Trading Lounge
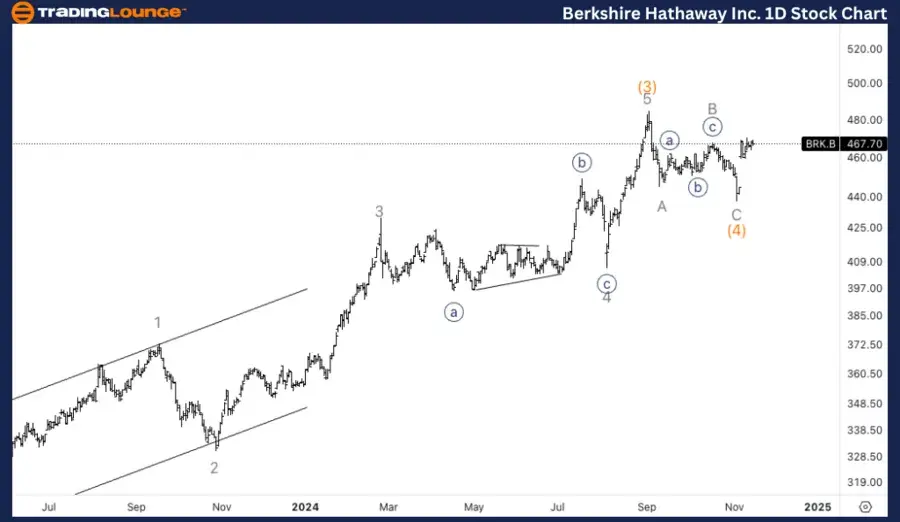
Berkshire Hathaway Inc., (BRK.B) Daily Chart
BRK.B Elliott Wave technical analysis
Function: Trend.
Mode: Impulsive.
Structure: Motive.
Position: Wave 1 of (5).
Direction: Upside in wave (5).
Details: Looking for upside into wave (5) as we seem to have bottomed in wave (4) after what appears to be a three wave move. Looking for further upside as we are just below TradingLevel5 at 500$.
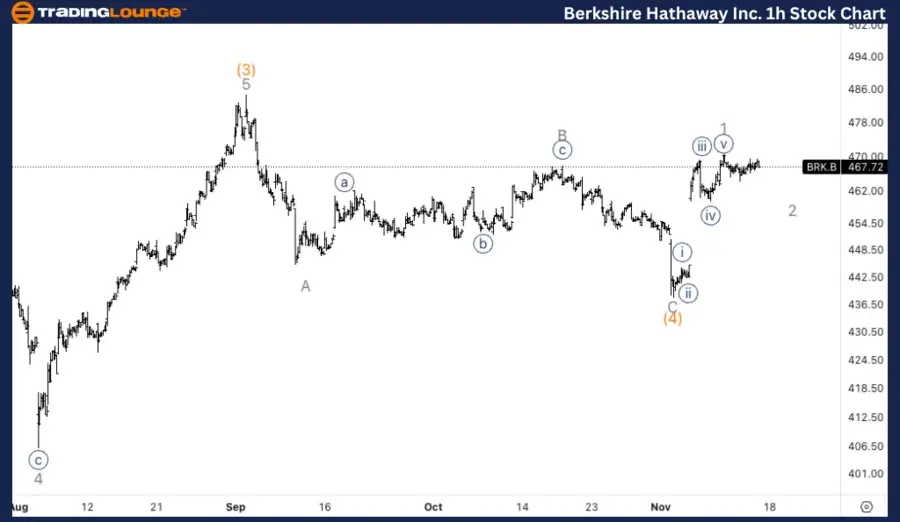
Berkshire Hathaway Inc., (BRK.B) 1H Chart
BRK.B Elliott Wave technical analysis
Function: Trend.
Mode: Impulsive.
Structure: Motive.
Position: Wave 1 of (5).
Direction: Pull back in wave 2.
Details: Looking for completion in wave 2 of (5), as we seem to be missing at least another leg lower after what appears to be a three wave move in wave 1. We could see a pullback around 465$.
This analysis of Berkshire Hathaway Inc., (BRK.B) focuses on both the daily and 1-hour charts, using the Elliott Wave Theory to assess current market trends and forecast future price movements.
BRK.B Elliott Wave technical analysis – Daily chart
On the daily chart, BRK.B is expected to continue rising as it begins wave (5) after what looks like a completed three-wave corrective structure in wave (4). The stock is positioned just below the TradingLevel5 at $500, which is expected to act as resistance. Breaking through this level would confirm further upside potential into wave (5).
BRK.B Elliott Wave Technical Analysis – One-hour chart
On the 1-hour chart, BRK.B is in the process of completing wave 2 of wave (5). There appears to be another leg down missing before this wave is complete, suggesting that wave 2 is still unfolding. A support level around $465 could provide a potential turning point, where the stock may find a bottom before resuming the upward movement in wave 3 of (5).
Technical analyst: Alessio Barretta.
BRK.B Elliott Wave technical analysis [Video]
Author

Peter Mathers
TradingLounge
Peter Mathers started actively trading in 1982. He began his career at Hoei and Shoin, a Japanese futures trading company.


